import java.awt.Graphics2D;
import java.awt.font.LineMetrics;
import java.awt.geom.Rectangle2D;
import java.util.List;
import java.awt.Color;
import org.jfree.chart.axis.AxisState;
import org.jfree.chart.axis.NumberAxis;
import org.jfree.chart.axis.ValueTick;
import org.jfree.text.TextUtilities;
import org.jfree.ui.RectangleEdge;
import org.jfree.ui.TextAnchor;
public class DayOfYearAxis extends NumberAxis {
public static final Integer[] MONTH_LENGTHS = {
31,29,31,30,31,30,31,31,30,31,30,31
};
public static final String[] MONTH_NAMES = {
"Jan","Feb","Mar","Apr","May","Jun","Jul","Aug","Sep","Oct","Nov","Dec"
};
protected AxisState drawTickMarksAndLabels(Graphics2D g2,double cursor,Rectangle2D plotArea,Rectangle2D dataArea,RectangleEdge edge) {
AxisState state = new AxisState(cursor);
g2.setFont(getTickLabelFont());
double ol = getTickMarkOutsideLength();
double il = getTickMarkInsideLength();
int y = (int)(Math.round(cursor-ol));
LineMetrics lineMetrics = g2.getFont().getLineMetrics("Ápr", g2.getFontRenderContext());
int h = (int) (lineMetrics.getHeight() + 6);
List<ValueTick> ticks = refreshTicks(g2, state, dataArea, edge);
state.setTicks(ticks);
ValueTick tick = ticks.get(ticks.size()-1);
float[] prevAnchorPoint = calculateAnchorPoint(tick, cursor,dataArea, edge);
double xmax = prevAnchorPoint[0];
double max_day = tick.getValue();
tick = ticks.get(0);
prevAnchorPoint = calculateAnchorPoint(tick, cursor,dataArea, edge);
double xmin = Math.round(prevAnchorPoint[0]);
double min_day = tick.getValue();
double days_visible = max_day - min_day + 1;
double gap = 0.1*(xmax-xmin)/days_visible;
System.out.println("min_day "+min_day+" max_day"+max_day);
g2.setFont(getTickLabelFont());
g2.setColor(Color.BLACK);
int start_day = 0;
for (int month=0;month<12;month++) {
int end_day = start_day + MONTH_LENGTHS[month] - 1;
System.out.println("start-end "+start_day+" "+end_day);
if ( (start_day>=min_day) && (start_day<=max_day) && (end_day>=min_day) && (end_day<=max_day) ) {
double factor_x1 = (start_day - min_day) / days_visible;
double x1 = xmin + (xmax-xmin)* factor_x1;
double factor_x2 = (end_day - min_day) / days_visible;
double x2 = xmin + (xmax-xmin)* factor_x2;
System.out.println("month="+month+", start_day="+start_day+" end_day="+end_day+" x1="+x1+" x2="+x2);
g2.setColor(Color.LIGHT_GRAY);
g2.fill3DRect((int)(x1+gap),y,(int)(x2-x1-2*gap),h,true);
g2.setColor(Color.BLACK);
TextUtilities.drawAlignedString(MONTH_NAMES[month], g2, (float)((x1+x2)/2), (float)(y+ol), TextAnchor.TOP_CENTER);
}
start_day += MONTH_LENGTHS[month];
}
return state;
}
}
使用方法:
    JFreeChart chart = ChartFactory.createXYLineChart(...);
    DayOfYearAxis doyAxis = new DayOfYearAxis();
    /* optional
    doyAxis.setAutoRange(false);
    doyAxis.setRange(new Range(min_yday, max_yday));
    */
    chart.getXYPlot().setDomainAxis(doyAxis);
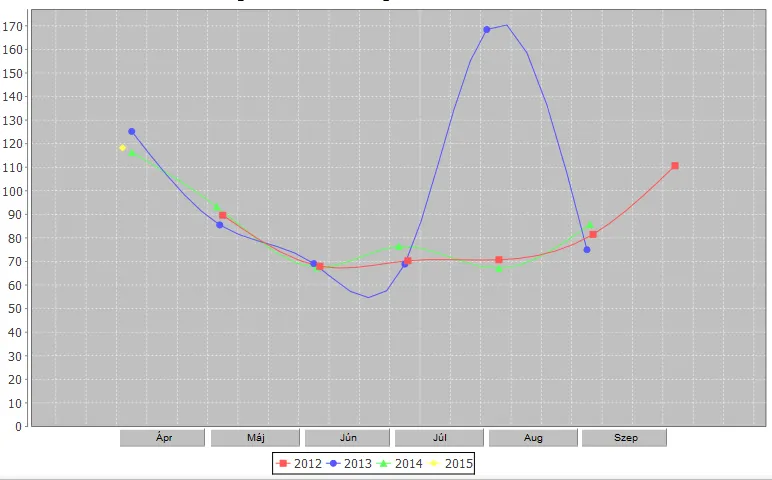
示例输出(使用匈牙利月份名称):
SymbolAxis。 - trashgod