JFreeChart的X轴标签超出了图表区域

3

我有一个使用JFreeChartDateAxis作为横轴的图表。它看起来很好,但有时最后一个横轴标签会超出图表区域。以下是可复现该问题的示例代码:

public class LineChart_AWT extends ApplicationFrame {

    public LineChart_AWT( String applicationTitle , String chartTitle ) {
          super(applicationTitle);

          ValueAxis timeAxis = new DateAxis("");
          NumberAxis valueAxis = new NumberAxis("Number");
          ((DateAxis)timeAxis).setDateFormatOverride(new SimpleDateFormat("YYYY-MM-dd HH:mm"));
          XYPlot plot = new XYPlot(createDataset(), timeAxis, valueAxis, null);
          XYLineAndShapeRenderer renderer = new XYLineAndShapeRenderer(true, false);

          plot.setRenderer(renderer);
          plot.getRangeAxis().setAutoRange(true);
          ((NumberAxis)plot.getRangeAxis()).setAutoRangeIncludesZero(false);
          JFreeChart lineChart = new JFreeChart(chartTitle, plot);
          plot.setBackgroundPaint(Color.lightGray);

          plot.setDomainGridlinesVisible(true);
          plot.setRangeGridlinesVisible(true);
          plot.setDomainGridlinePaint(Color.white);
          plot.setRangeGridlinePaint(Color.white);

          lineChart.setBackgroundPaint(Color.white);
          ChartPanel chartPanel = new ChartPanel( lineChart );
          chartPanel.setPreferredSize( new java.awt.Dimension( 560 , 367 ) );
          setContentPane( chartPanel );
       }

       private TimeSeriesCollection createDataset( ) {
           TimeSeries typeA = new TimeSeries("TypeA");
         TimeSeries typeB = new TimeSeries("TypeB");
         TimeSeriesCollection collection = new TimeSeriesCollection();

         collection.addSeries(typeA);
         collection.addSeries(typeB);
         typeA = collection.getSeries("TypeA");

         typeA.add(new Hour(8, new Day()), 1.0);
         typeA.add(new Hour(10, new Day()), 1.0);
         typeA.add(new Hour(11, new Day()), 1.0);
         typeA.add(new Hour(13, new Day()), 1.0);
         typeA.add(new Hour(16, new Day()), 2.0);
         typeA.add(new Hour(18, new Day()), 2.0);

         typeB.add(new Hour(8, new Day()), 1.0);
         typeB.add(new Hour(19, new Day()), 2.0);
         typeB.add(new Hour(20, new Day()), 5.0);


          return collection;
       }

       public static void main( String[ ] args ) {
          LineChart_AWT chart = new LineChart_AWT(
             "X-axis demo" ,
             "X-axis labels are truncated");

          chart.pack( );
          RefineryUtilities.centerFrameOnScreen( chart );
          chart.setVisible( true );
       }
    }

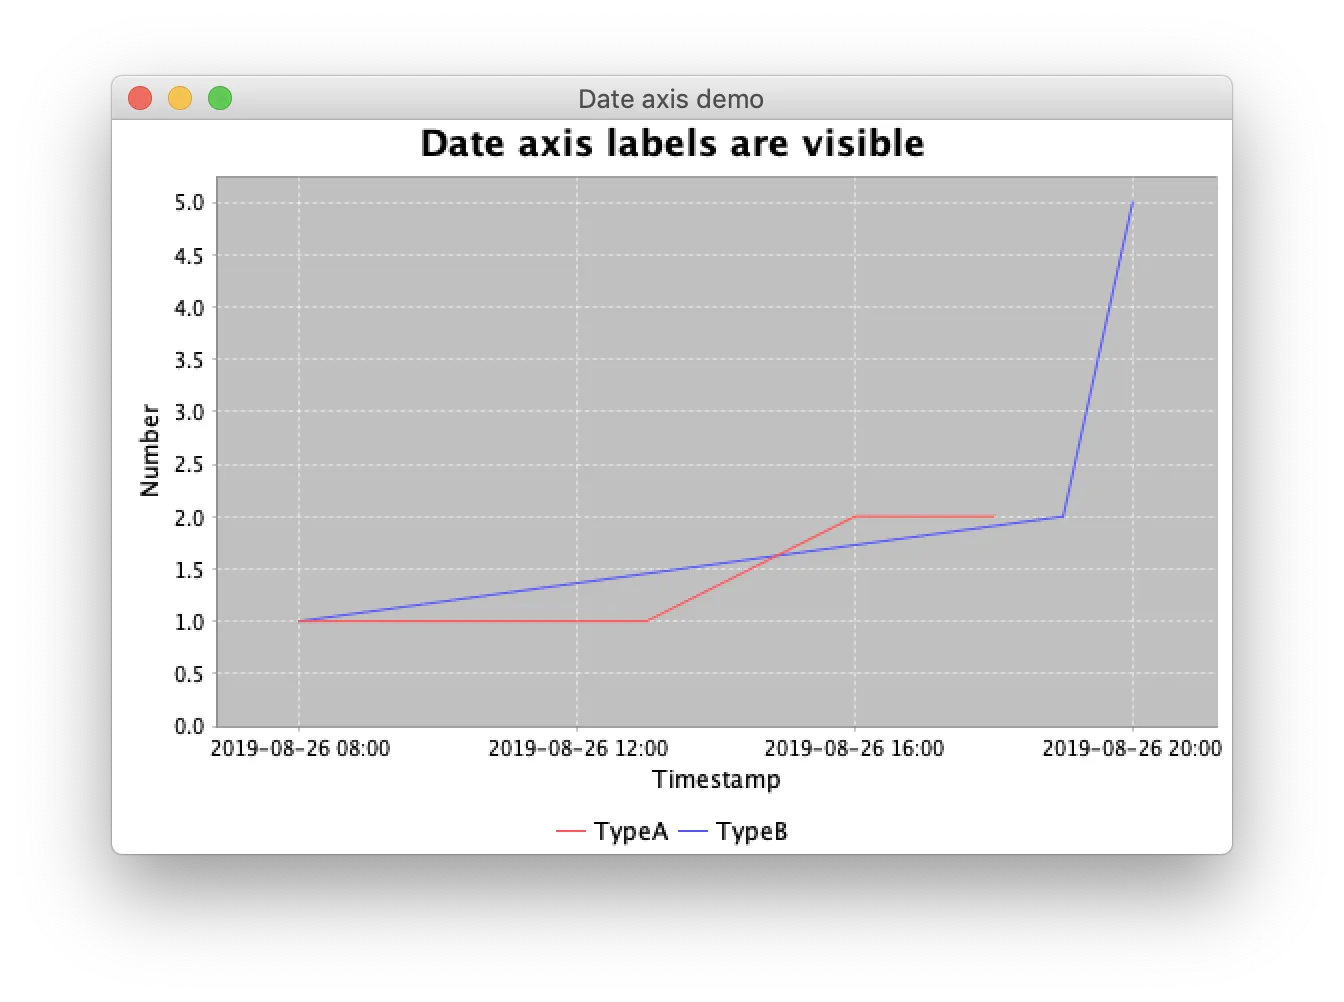
以下是当前的截图;问题可以在最后一个标签上看到:

date labels clipped

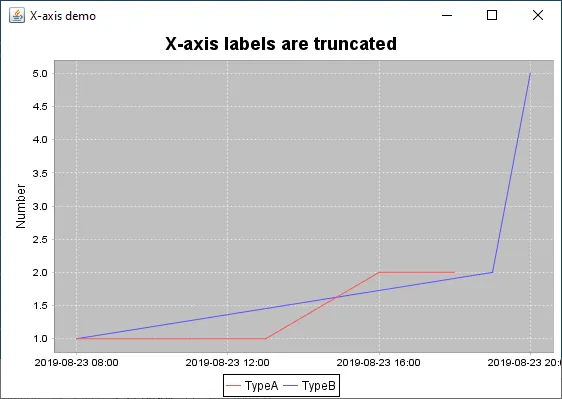
是什么导致最后一个标签被渲染到当前图表区域之外?如何防止它发生?

更新

这里有一个更全面的例子,包括了所有细节和截图。

根据 @trashgod 的评论,我已经升级到最新的 JFreeChart 引擎 (jfreechart-1.0.19.jar 和 jcommon-1.0.23.jar) (jfreechart-1.6.0-snapshot.jar)。

考虑以下示例(深度依赖于 @trashgod 的建议 - 非常感谢):

import java.awt.Color;
import java.awt.Dimension;
import java.awt.EventQueue;
import java.text.SimpleDateFormat;
import org.jfree.chart.ChartPanel;
import org.jfree.chart.JFreeChart;
import org.jfree.chart.axis.DateAxis;
import org.jfree.chart.axis.NumberAxis;
import org.jfree.chart.plot.XYPlot;
import org.jfree.chart.renderer.xy.XYLineAndShapeRenderer;
import org.jfree.chart.ui.ApplicationFrame;
import org.jfree.data.time.Minute;
import org.jfree.data.time.TimeSeries;
import org.jfree.data.time.TimeSeriesCollection;

/**
 * @see https://dev59.com/xrXna4cB1Zd3GeqPSeeV#57637615
 * @see https://stackoverflow.com/a/57544811/230513
 */
public class TimeChart extends ApplicationFrame {

    private static boolean lot_of_values = false;

    public TimeChart(String applicationTitle, String chartTitle) {
        super(applicationTitle);

        DateAxis timeAxis = new DateAxis("Timestamp");
        timeAxis.setUpperMargin(DateAxis.DEFAULT_UPPER_MARGIN /* * 2*/); // UPDATED
        timeAxis.setLowerMargin(DateAxis.DEFAULT_LOWER_MARGIN /* * 2*/); // UPDATED
        timeAxis.setDateFormatOverride(new SimpleDateFormat("YYYY-MM-dd HH:mm"));
        NumberAxis numberAxis = new NumberAxis("Number");
        numberAxis.setAutoRangeIncludesZero(false);
        XYLineAndShapeRenderer renderer = new XYLineAndShapeRenderer(true, false);
        XYPlot plot = new XYPlot(createDataset(), timeAxis, numberAxis, renderer);
        plot.setBackgroundPaint(Color.lightGray);
        plot.setDomainGridlinePaint(Color.white);
        plot.setRangeGridlinePaint(Color.white);
        JFreeChart lineChart = new JFreeChart(chartTitle, plot);
        lineChart.setBackgroundPaint(Color.white);
        ChartPanel chartPanel = new ChartPanel(lineChart) {
            @Override
            public Dimension getPreferredSize() {
                return new Dimension(1529 , 538);
            }
        };
        add(chartPanel);
    }

    private TimeSeriesCollection createDataset() {

        TimeSeries typeA = new TimeSeries("Temperatures");
        TimeSeriesCollection collection = new TimeSeriesCollection();

        collection.addSeries(typeA);

        if (lot_of_values) {
            typeA.add(Minute.parseMinute("2019-08-25 00:00"), 26.68);
            typeA.add(Minute.parseMinute("2019-08-25 01:00"), 26.75);
            typeA.add(Minute.parseMinute("2019-08-25 02:00"), 25.95);
            typeA.add(Minute.parseMinute("2019-08-25 03:00"), 25.47);
            typeA.add(Minute.parseMinute("2019-08-25 04:00"), 25.19);
            typeA.add(Minute.parseMinute("2019-08-25 05:00"), 24.65);
            typeA.add(Minute.parseMinute("2019-08-25 06:00"), 24.61);
            typeA.add(Minute.parseMinute("2019-08-25 07:00"), 25.58);
            typeA.add(Minute.parseMinute("2019-08-25 08:00"), 26.43);
            typeA.add(Minute.parseMinute("2019-08-25 09:00"), 26.96);
            typeA.add(Minute.parseMinute("2019-08-25 10:00"), 27.81);
            typeA.add(Minute.parseMinute("2019-08-25 11:00"), 28.69);
            typeA.add(Minute.parseMinute("2019-08-25 12:00"), 29.39);
            typeA.add(Minute.parseMinute("2019-08-25 13:00"), 29.89);
            typeA.add(Minute.parseMinute("2019-08-25 14:00"), 30.32);
            typeA.add(Minute.parseMinute("2019-08-25 15:00"), 30.69);
            typeA.add(Minute.parseMinute("2019-08-25 16:00"), 30.83);
            typeA.add(Minute.parseMinute("2019-08-25 17:00"), 30.85);
            typeA.add(Minute.parseMinute("2019-08-25 18:00"), 30.64);
            typeA.add(Minute.parseMinute("2019-08-25 19:00"), 30.04);
            typeA.add(Minute.parseMinute("2019-08-25 20:00"), 29.51);
            typeA.add(Minute.parseMinute("2019-08-25 21:00"), 28.63);
            typeA.add(Minute.parseMinute("2019-08-25 22:00"), 28.48);
            typeA.add(Minute.parseMinute("2019-08-25 23:00"), 27.15);
            typeA.add(Minute.parseMinute("2019-08-26 00:00"), 27.3);
            typeA.add(Minute.parseMinute("2019-08-26 01:00"), 27.05);
            typeA.add(Minute.parseMinute("2019-08-26 02:00"), 26.84);
            typeA.add(Minute.parseMinute("2019-08-26 03:00"), 26.47);
            typeA.add(Minute.parseMinute("2019-08-26 04:00"), 26.34);
            typeA.add(Minute.parseMinute("2019-08-26 05:00"), 25.95);
            typeA.add(Minute.parseMinute("2019-08-26 06:00"), 26.46);
            typeA.add(Minute.parseMinute("2019-08-26 07:00"), 26.75);
            typeA.add(Minute.parseMinute("2019-08-26 08:00"), 26.94);
            typeA.add(Minute.parseMinute("2019-08-26 09:00"), 27.05);
            typeA.add(Minute.parseMinute("2019-08-26 10:00"), 27.35);
            typeA.add(Minute.parseMinute("2019-08-26 11:00"), 27.67);
            typeA.add(Minute.parseMinute("2019-08-26 12:00"), 28.12);
            typeA.add(Minute.parseMinute("2019-08-26 13:00"), 28.41);
            typeA.add(Minute.parseMinute("2019-08-26 14:00"), 28.67);
            typeA.add(Minute.parseMinute("2019-08-26 15:00"), 28.99);
            typeA.add(Minute.parseMinute("2019-08-26 16:00"), 28.99);
            typeA.add(Minute.parseMinute("2019-08-26 17:00"), 29.02);
            typeA.add(Minute.parseMinute("2019-08-26 18:00"), 29.02);
            typeA.add(Minute.parseMinute("2019-08-26 19:00"), 28.43);
            typeA.add(Minute.parseMinute("2019-08-26 20:00"), 27.87);
            typeA.add(Minute.parseMinute("2019-08-26 21:00"), 27.2);
            typeA.add(Minute.parseMinute("2019-08-26 22:00"), 26.88);
            typeA.add(Minute.parseMinute("2019-08-26 23:00"), 26.31);
            typeA.add(Minute.parseMinute("2019-08-27 00:00"), 26.02);
            typeA.add(Minute.parseMinute("2019-08-27 01:00"), 25.51);
            typeA.add(Minute.parseMinute("2019-08-27 02:00"), 25.12);
            typeA.add(Minute.parseMinute("2019-08-27 03:00"), 25.11);
            typeA.add(Minute.parseMinute("2019-08-27 04:00"), 24.97);
            typeA.add(Minute.parseMinute("2019-08-27 05:00"), 24.85);
            typeA.add(Minute.parseMinute("2019-08-27 06:00"), 24.73);
            typeA.add(Minute.parseMinute("2019-08-27 07:00"), 25.04);
            typeA.add(Minute.parseMinute("2019-08-27 08:00"), 25.68);
            typeA.add(Minute.parseMinute("2019-08-27 09:00"), 26.22);
            typeA.add(Minute.parseMinute("2019-08-27 10:00"), 26.69);
            typeA.add(Minute.parseMinute("2019-08-27 11:00"), 27.3);
            typeA.add(Minute.parseMinute("2019-08-27 12:00"), 27.84);
            typeA.add(Minute.parseMinute("2019-08-27 13:00"), 28.26);
            typeA.add(Minute.parseMinute("2019-08-27 14:00"), 28.6);
            typeA.add(Minute.parseMinute("2019-08-27 15:00"), 29.03);
            typeA.add(Minute.parseMinute("2019-08-27 16:00"), 29.38);
            typeA.add(Minute.parseMinute("2019-08-27 17:00"), 29.62);
            typeA.add(Minute.parseMinute("2019-08-27 18:00"), 29.47);
            typeA.add(Minute.parseMinute("2019-08-27 19:00"), 29.01);
            typeA.add(Minute.parseMinute("2019-08-27 20:00"), 28.31);
            typeA.add(Minute.parseMinute("2019-08-27 21:00"), 27.69);
            typeA.add(Minute.parseMinute("2019-08-27 22:00"), 26.93);
            typeA.add(Minute.parseMinute("2019-08-27 23:00"), 26.37);
        }

        typeA.add(Minute.parseMinute("2019-08-28 00:00"), 26.12);
        typeA.add(Minute.parseMinute("2019-08-28 01:00"), 25.77);
        typeA.add(Minute.parseMinute("2019-08-28 02:00"), 25.42);
        typeA.add(Minute.parseMinute("2019-08-28 03:00"), 25.0);
        typeA.add(Minute.parseMinute("2019-08-28 04:00"), 24.57);
        typeA.add(Minute.parseMinute("2019-08-28 05:00"), 24.23);
        typeA.add(Minute.parseMinute("2019-08-28 06:00"), 24.38);
        typeA.add(Minute.parseMinute("2019-08-28 07:00"), 24.99);
        typeA.add(Minute.parseMinute("2019-08-28 08:00"), 25.86);
        typeA.add(Minute.parseMinute("2019-08-28 09:00"), 26.53);
        typeA.add(Minute.parseMinute("2019-08-28 10:00"), 27.32);
        typeA.add(Minute.parseMinute("2019-08-28 11:00"), 27.95);
        typeA.add(Minute.parseMinute("2019-08-28 12:00"), 28.64);
        typeA.add(Minute.parseMinute("2019-08-28 13:00"), 29.38);
        typeA.add(Minute.parseMinute("2019-08-28 14:00"), 29.74);
        typeA.add(Minute.parseMinute("2019-08-28 15:00"), 30.13);
        typeA.add(Minute.parseMinute("2019-08-28 16:00"), 30.42);
        typeA.add(Minute.parseMinute("2019-08-28 17:00"), 30.48);
        typeA.add(Minute.parseMinute("2019-08-28 18:00"), 30.14);
        typeA.add(Minute.parseMinute("2019-08-28 19:00"), 29.41);
        typeA.add(Minute.parseMinute("2019-08-28 20:00"), 28.47);
        typeA.add(Minute.parseMinute("2019-08-28 21:00"), 28.05);


        return collection;
    }

    public static void main(String[] args) {
        EventQueue.invokeLater(new Runnable() {
            @Override
            public void run() {
                TimeChart chart = new TimeChart(
                    "Date axis demo",
                    "Date axis labels are visible");

                chart.pack();
                chart.setVisible(true);
            }
        });
    }
}

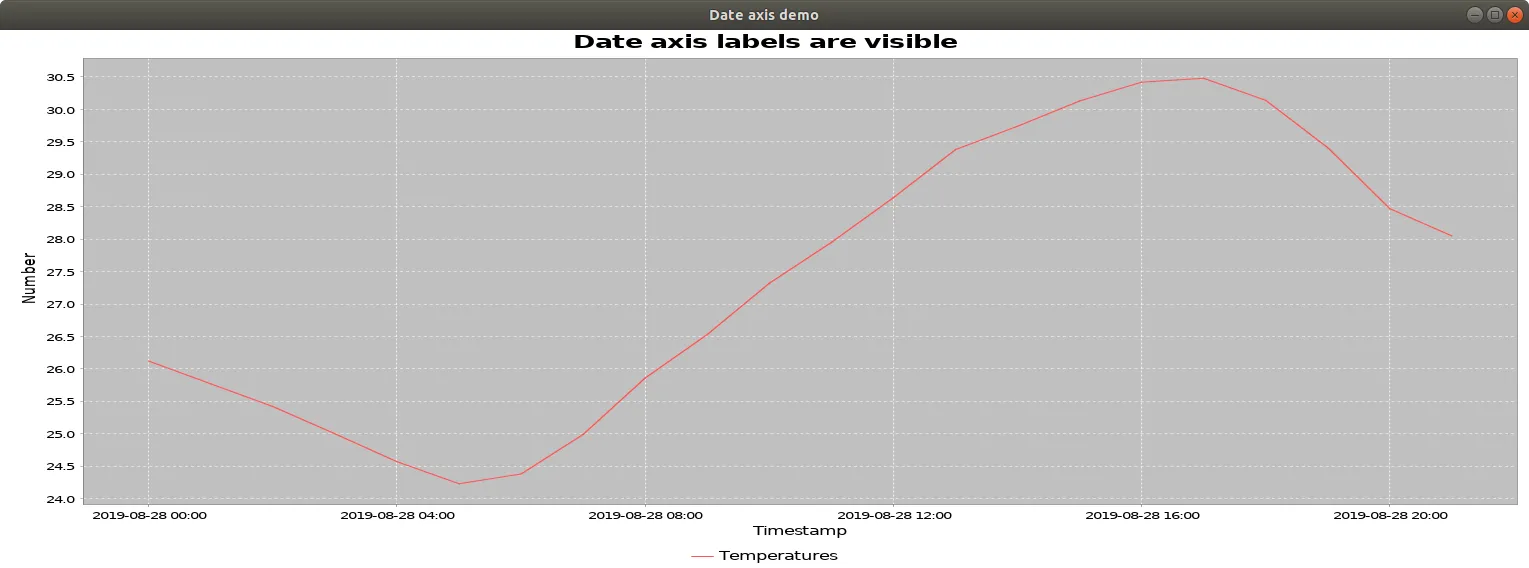
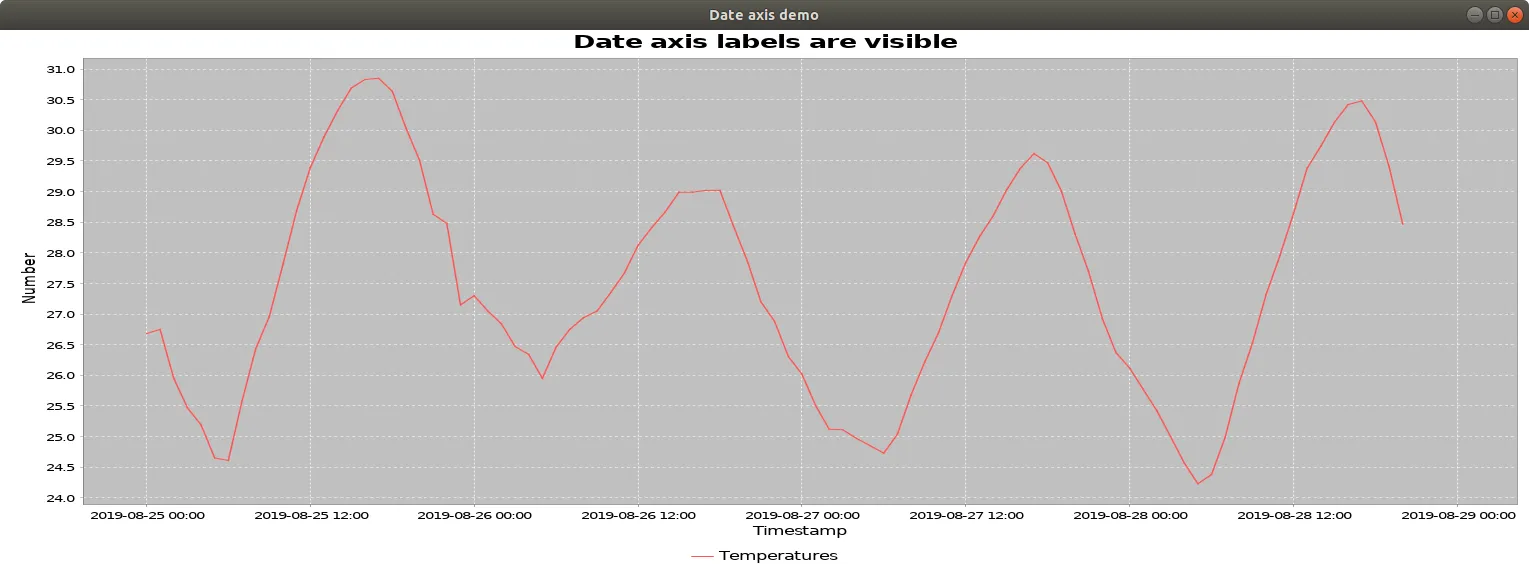
请注意,我已将首选图表大小更改为1529 x 538(我需要生成一个PNG),并引入了一个名为lot_of_values的新静态变量。最初,它被设置为false,以下是其截图:

enter image description here

但是如果我将lot_of_values更改为true(这将向集合中添加更多数据-您可以在源代码中看到),则域轴的最后一个标签将被切断。以下是lot_of_values=true时的截图:

enter image description here

更新2

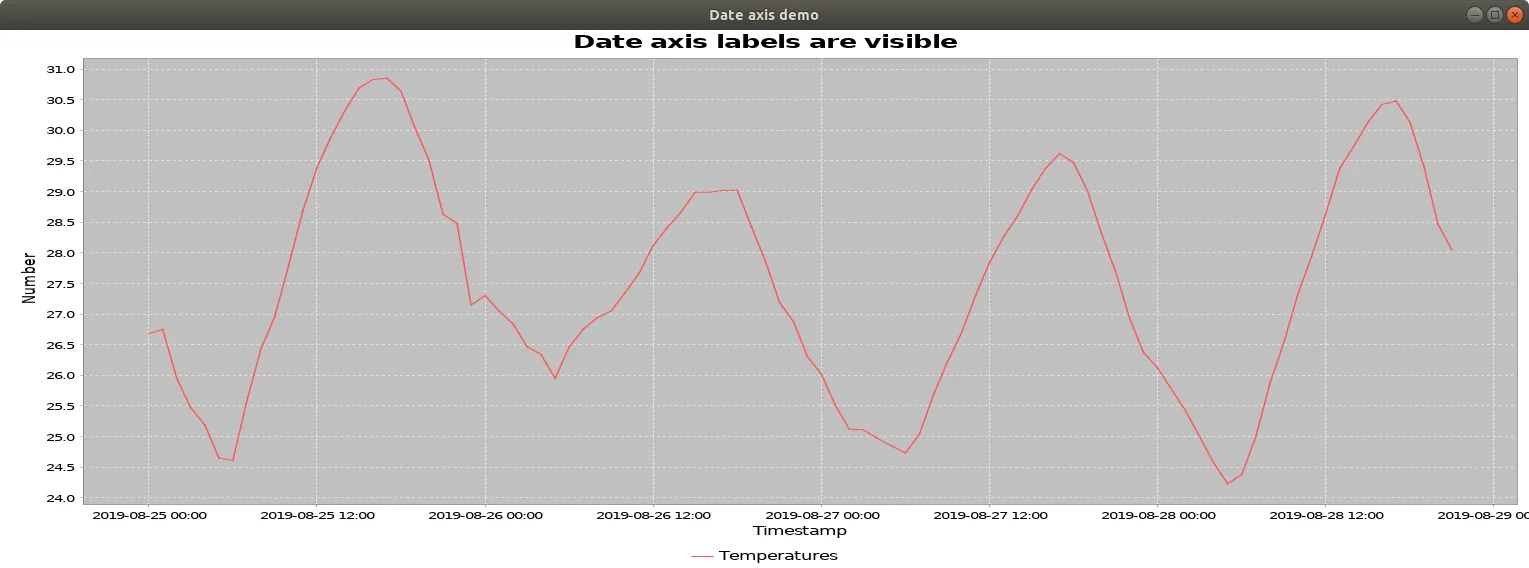
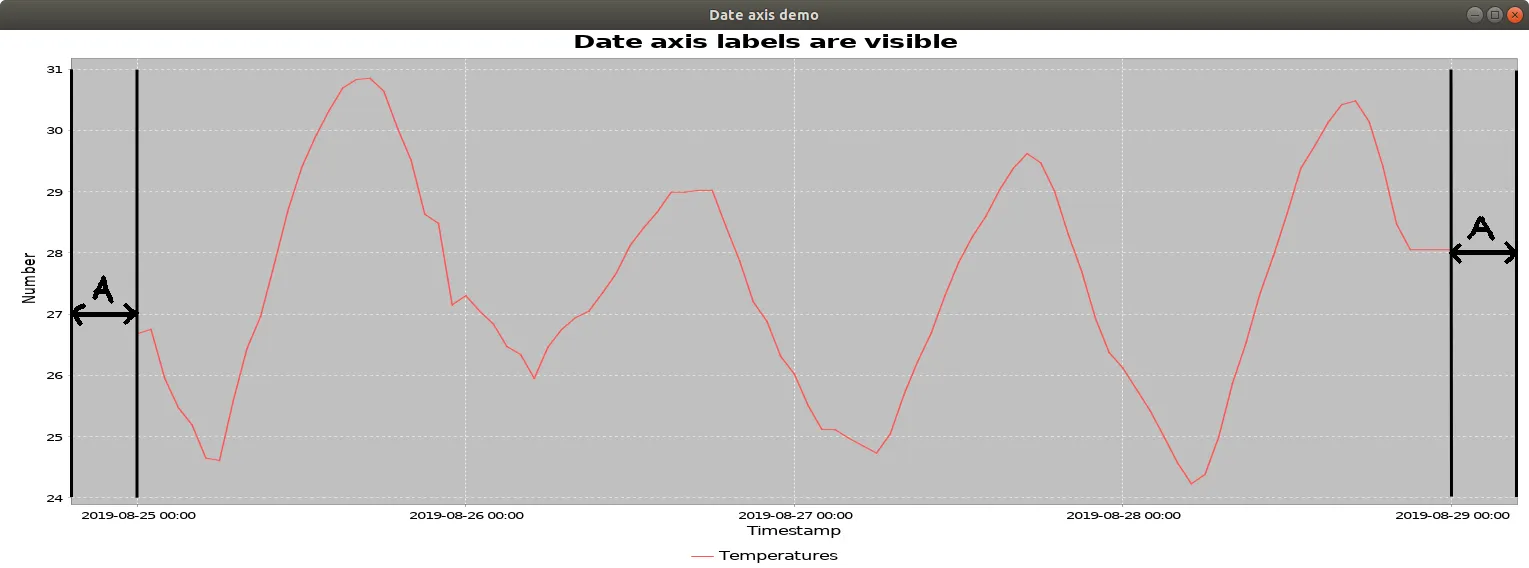
我已经深入研究了JFreeChart的源代码,并正在解决问题。(此外,我还不得不从上面的源代码中删除一些行以适应30k字符限制)
请考虑以下截图: enter image description here 
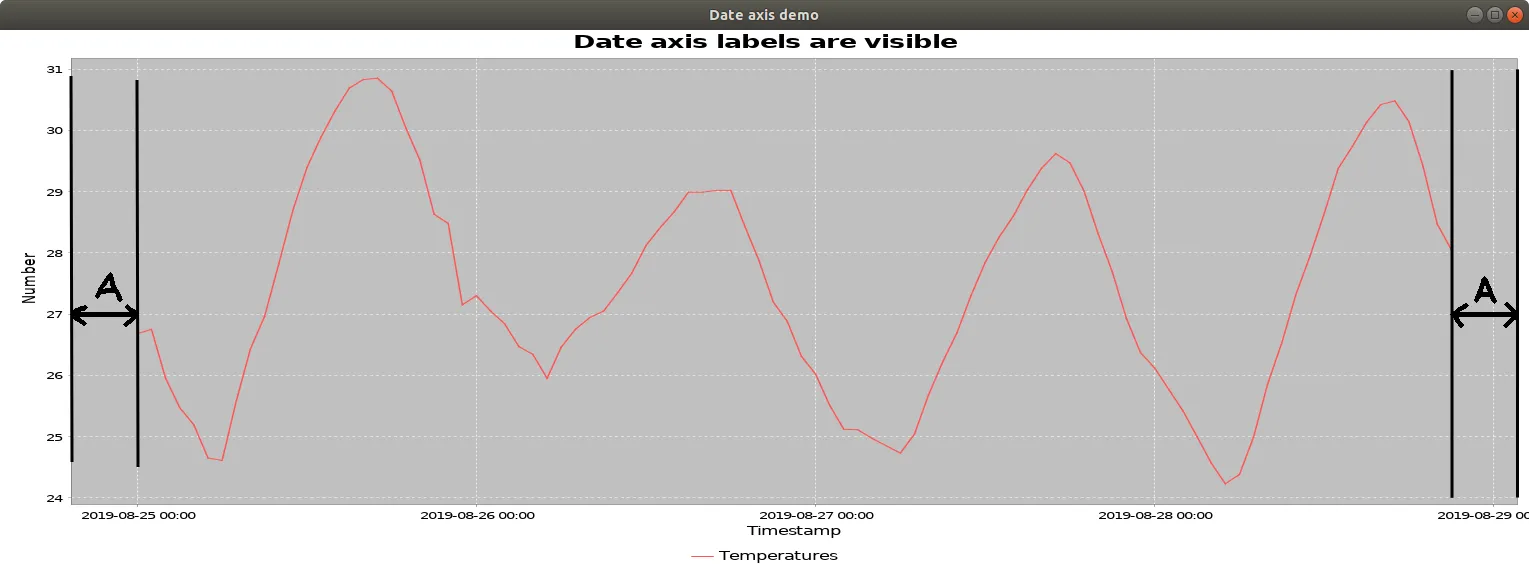
我认为边距值应用于图表当前数据绘制之前和之后,而不是当前范围刻度。这就是为什么最后一个刻度标签可能会被削减的原因。
如果数据填充到最后一个刻度(目前为2019-08-29 00:00),那么这将不是问题,因为在这种情况下,边距将允许正确打印该值。
让我们看一个概念证明。我向数据集中添加了三行:
typeA.add(Minute.parseMinute("2019-08-28 21:00"), 28.05); //original line
typeA.add(Minute.parseMinute("2019-08-28 22:00"), 28.05); //new line
typeA.add(Minute.parseMinute("2019-08-28 23:00"), 28.05); //new line
typeA.add(Minute.parseMinute("2019-08-29 00:00"), 28.05); //new line

现在的结果如下所示: enter image description here 也可以通过调用以下代码来修改轴的最大日期来实现此目标:
timeAxis.setMaximumDate(new Date(119,7,29,4,36));

现在我将继续寻找计算MaximumDate的地方。如果有人知道,请告诉我。

2个回答

2
效果是一种人为减小图表首选大小并明确增加日期轴刻度标签大小所导致的人工制品。请注意,省略对 setPreferredSize() 的调用会消除此效果。或者,您可以设置轴边距来进行补偿,如此处所建议。下面的示例将默认的上下边距加倍,从10%增加到一个刻度间隔的20%。
timeAxis.setUpperMargin(DateAxis.DEFAULT_UPPER_MARGIN * 2);
timeAxis.setLowerMargin(DateAxis.DEFAULT_LOWER_MARGIN * 2);

更准确地说:这是针对这些标签长度的最终解决方案还是当前情况下的特定hack?
DateAxis使用标签的计算大小将标签居中于其刻度/网格线上。由于字体大小因平台而异,标签大小因格式和语言环境而异,因此始终存在一些组合值可能会剪裁给定尺寸的包含组件的标签。随着组件的调整大小,显示的标签数量将发生变化以优化显示。只要允许图表随着大小的变化进行调整(在此处讨论),用户就不会有任何问题。调整示例的框架大小或使用这些内置控件来查看效果。
我不想硬编码数据集;即使我只有1个记录或者有100个记录,图表也必须看起来很好。
为此,引导用户使用适合您用例的交互特性:这个例子使用组合框监听器来切换setVerticalTickLabels();您可以像这里所示一样保留用户的偏好设置。这个例子提供了一个缩放控件的工具栏。这里引用的例子将平移与setMouseWheelEnabled()结合起来。

顺便提一下,不要忽视这里提到的其他问题,因为它们是常见的陷阱,可能会使其他问题难以隔离。

margins doubled

import java.awt.Color;
import java.awt.Dimension;
import java.awt.EventQueue;
import java.text.SimpleDateFormat;
import org.jfree.chart.ChartPanel;
import org.jfree.chart.JFreeChart;
import org.jfree.chart.axis.DateAxis;
import org.jfree.chart.axis.NumberAxis;
import org.jfree.chart.plot.XYPlot;
import org.jfree.chart.renderer.xy.XYLineAndShapeRenderer;
import org.jfree.chart.ui.ApplicationFrame;
import org.jfree.chart.ui.UIUtils;
import org.jfree.data.time.Day;
import org.jfree.data.time.Hour;
import org.jfree.data.time.TimeSeries;
import org.jfree.data.time.TimeSeriesCollection;

/**
 * @see https://dev59.com/xrXna4cB1Zd3GeqPSeeV#57637615
 * @see https://stackoverflow.com/a/57544811/230513
 */
public class TimeChart extends ApplicationFrame {

    public TimeChart(String applicationTitle, String chartTitle) {
        super(applicationTitle);

        DateAxis timeAxis = new DateAxis("Timestamp");
        timeAxis.setUpperMargin(DateAxis.DEFAULT_UPPER_MARGIN * 2);
        timeAxis.setLowerMargin(DateAxis.DEFAULT_LOWER_MARGIN * 2);
        timeAxis.setDateFormatOverride(new SimpleDateFormat("YYYY-MM-dd HH:mm"));
        NumberAxis numberAxis = new NumberAxis("Number");
        XYLineAndShapeRenderer renderer = new XYLineAndShapeRenderer(true, false);
        XYPlot plot = new XYPlot(createDataset(), timeAxis, numberAxis, renderer);
        plot.setBackgroundPaint(Color.lightGray);
        plot.setDomainGridlinePaint(Color.white);
        plot.setRangeGridlinePaint(Color.white);
        JFreeChart lineChart = new JFreeChart(chartTitle, plot);
        lineChart.setBackgroundPaint(Color.white);
        ChartPanel chartPanel = new ChartPanel(lineChart) {
            @Override
            public Dimension getPreferredSize() {
                return new Dimension(560 , 367);
            }
        };
        add(chartPanel);
    }

    private TimeSeriesCollection createDataset() {
        TimeSeries typeA = new TimeSeries("TypeA");
        TimeSeries typeB = new TimeSeries("TypeB");
        TimeSeriesCollection collection = new TimeSeriesCollection();

        collection.addSeries(typeA);
        collection.addSeries(typeB);
        typeA = collection.getSeries("TypeA");

        typeA.add(new Hour(8, new Day()), 1.0);
        typeA.add(new Hour(10, new Day()), 1.0);
        typeA.add(new Hour(11, new Day()), 1.0);
        typeA.add(new Hour(13, new Day()), 1.0);
        typeA.add(new Hour(16, new Day()), 2.0);
        typeA.add(new Hour(18, new Day()), 2.0);

        typeB.add(new Hour(8, new Day()), 1.0);
        typeB.add(new Hour(19, new Day()), 2.0);
        typeB.add(new Hour(20, new Day()), 5.0);

        return collection;
    }

    public static void main(String[] args) {
        EventQueue.invokeLater(new Runnable() {
            @Override
            public void run() {
                TimeChart chart = new TimeChart(
                    "Date axis demo",
                    "Date axis labels are visible");
                chart.pack();
                UIUtils.centerFrameOnScreen(chart);
                chart.setVisible(true);
            }
        });
    }
}

我使用了setPreferredSize()方法来告知图表其父窗口的大小已更改。这种方式是否不太好? - Daniel
是的,字体大小因平台而异;您可能需要微调边距;此外,调整框架大小以查看效果;请注意将图表面板添加到框架默认边框布局中心的效果。 - trashgod
JFrame 的默认布局是 BorderLayout;默认的位置是 CENTER,这允许图表面板调整大小;尝试使用 DateAxis.DEFAULT_UPPER_MARGIN * 2 - trashgod
谢谢。即使设置了初始值的双倍边框,标签裁剪仍会发生。好的,我可以测量标签的宽度,但如何知道它们是否被裁剪呢?注意:操作系统是Windows,但图表在浏览器中显示并由服务器端Java驱动。不过可能不会改变任何内容。 - Daniel
注意:只有在向图表添加更多数据时才会发生剪切。 (不是更长的标签,只有更多的数据) - Daniel
显示剩余14条评论

1

我已成功调查和解决了这个问题。

当JFreeChart决定其轴上的默认刻度时,它会计算标签的宽度,并检查它们是否适合在刻度之间,然后增加刻度直到标签适合为止。

这很好,但是在此过程中,JFreeChart没有检查最后一个标签是否适合绘图区域。

为了克服这种情况,您需要完成两项任务:

  1. 检查最后一个标签是否被裁剪
  2. 如果被裁剪,请纠正轴的范围

以下是我如何做到尽可能简洁而不触及JFreeChart源代码的方法:

import java.awt.Font;
import java.awt.FontMetrics;
import java.awt.Graphics2D;
import java.awt.font.FontRenderContext;
import java.awt.font.LineMetrics;
import java.awt.geom.Rectangle2D;
import java.text.DateFormat;
import java.util.Date;
import java.util.Locale;
import java.util.TimeZone;

import org.jfree.chart.axis.AxisState;
import org.jfree.chart.axis.DateAxis;
import org.jfree.chart.axis.DateTickUnit;
import org.jfree.chart.plot.PlotRenderingInfo;
import org.jfree.chart.ui.RectangleEdge;
import org.jfree.chart.ui.RectangleInsets;
import org.jfree.data.time.DateRange;

public class CorrectedDateAxis extends DateAxis {

    /** For serialization. */
    private static final long serialVersionUID = 0L;


    /**
     * Creates a date axis with no label.
     */
    public CorrectedDateAxis() {
        super(null);
    }

    /**
     * Creates a date axis with the specified label.
     *
     * @param label  the axis label ({@code null} permitted).
     */
    public CorrectedDateAxis(String label) {
        super(label);
    }

    /**
     * Creates a date axis.
     *
     * @param label  the axis label ({@code null} permitted).
     * @param zone  the time zone.
     * @param locale  the locale ({@code null} not permitted).
     */
    public CorrectedDateAxis(String label, TimeZone zone, Locale locale) {
        super(label, zone, locale);
    }

    /**
     * Estimates the maximum width of the tick labels, assuming the specified
     * tick unit is used.
     * <P>
     * Rather than computing the string bounds of every tick on the axis, we
     * just look at two values: the lower bound and the upper bound for the
     * axis.  These two values will usually be representative.
     *
     * @param g2  the graphics device.
     * @param unit  the tick unit to use for calculation.
     *
     * @return The estimated maximum width of the tick labels.
     */
    private double estimateMaximumTickLabelWidth(Graphics2D g2, 
            DateTickUnit unit) {

        RectangleInsets tickLabelInsets = getTickLabelInsets();
        double result = tickLabelInsets.getLeft() + tickLabelInsets.getRight();

        Font tickLabelFont = getTickLabelFont();
        FontRenderContext frc = g2.getFontRenderContext();
        LineMetrics lm = tickLabelFont.getLineMetrics("ABCxyz", frc);
        if (isVerticalTickLabels()) {
            // all tick labels have the same width (equal to the height of
            // the font)...
            result += lm.getHeight();
        }
        else {
            // look at lower and upper bounds...
            DateRange range = (DateRange) getRange();
            Date lower = range.getLowerDate();
            Date upper = range.getUpperDate();
            String lowerStr, upperStr;
            DateFormat formatter = getDateFormatOverride();
            if (formatter != null) {
                lowerStr = formatter.format(lower);
                upperStr = formatter.format(upper);
            }
            else {
                lowerStr = unit.dateToString(lower);
                upperStr = unit.dateToString(upper);
            }
            FontMetrics fm = g2.getFontMetrics(tickLabelFont);
            double w1 = fm.stringWidth(lowerStr);
            double w2 = fm.stringWidth(upperStr);
            result += Math.max(w1, w2);
        }

        return result;
    }   

    @Override
    public AxisState draw(Graphics2D g2, double cursor, Rectangle2D plotArea, Rectangle2D dataArea, RectangleEdge edge,
            PlotRenderingInfo plotState) {

        double labelWidth = estimateMaximumTickLabelWidth(g2, getTickUnit());

        double lastLabelPosition = dateToJava2D(calculateHighestVisibleTickValue(getTickUnit()),
                plotArea, edge);

        if (lastLabelPosition + labelWidth / 2 > plotArea.getMaxX()) {
            double plottingWidthCorrection = plotArea.getX() + (lastLabelPosition + labelWidth / 2) - plotArea.getMaxX();

            // Calculate and set the new corrected maximum date
            setMaximumDate(new Date((long)(getMaximumDate().getTime() + java2DToValue(plottingWidthCorrection, plotArea, edge) - getMinimumDate().getTime())));
        }

        return super.draw(g2, cursor, plotArea, dataArea, edge, plotState);
    }
}

这是对DateAxis类的覆盖,它可以完成上述两个任务。
请注意,此子类包含许多从JFreeChart的DateAxis类中复制的代码,因为他们将estimateMaximumTickLabelWidth定义为私有,所以子类无法访问它。
您可以修改原始的DateAxis类,将此函数定义为受保护的,以便在此子类中跳过此函数。
以下是CorrectedDateAxis出现并更正DateAxis范围的样子:

enter image description here

不再出现错误的标签结尾!


我已经使用这段代码来显示我的最后一个标签,但我的x轴是自定义的。开始标签之前的边距不再存在。有没有解决方案可以在x轴起始点处给出边距?我已经尝试过setUpperMargin()和setLowerMargin()。 - Harmeet Kaur
如果您的x轴是自定义的,您可以覆盖draw函数并计算实际区域的最佳值,就像我为DateAxis所做的那样。我认为setUpperMarginsetLowerMargin不适用于此代码,因为我的draw函数没有考虑到它们,但应用它们不应该很难。 - Daniel

网页内容由stack overflow 提供, 点击上面的
可以查看英文原文,
原文链接