Python绘图x轴仅显示选定项。

8

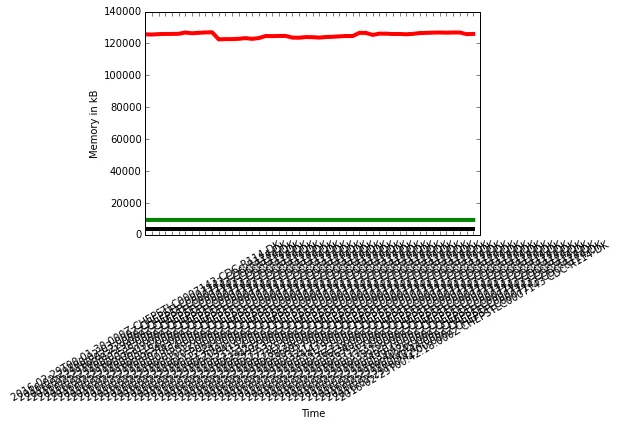
我有一个Python Matplotlib图表,如下所示。

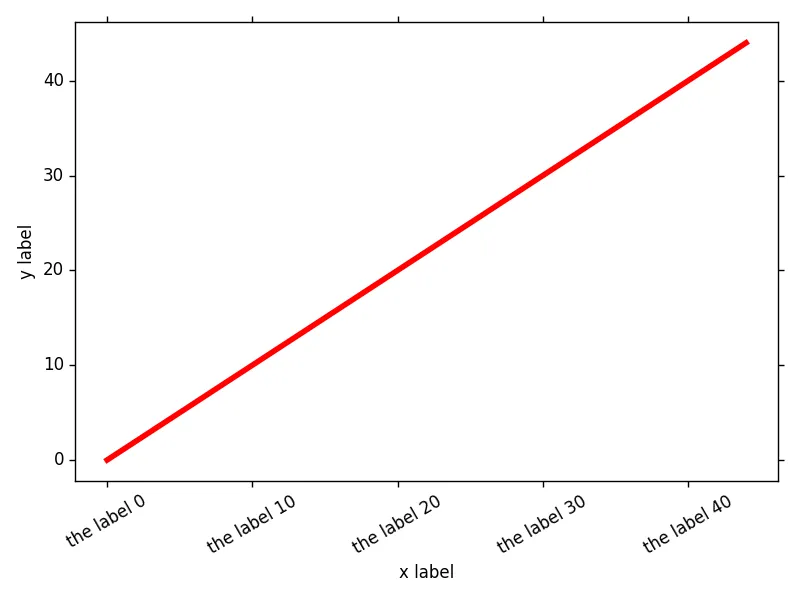
X轴上有100多个项目,我想要绘制它们所有,但只想显示大约25个左右(也许自动),以便观看更清晰。

你能帮忙吗?

谢谢。

我的代码如下:

l1 = plt.plot(b)
plt.setp(l1, linewidth=4, color='r')
l2 = plt.plot(c)
plt.setp(l2, linewidth=4, color='k')
l3 = plt.plot(d)
plt.setp(l3, linewidth=4, color='g')
plt.xticks(range(len(a)), a)
plt.xticks(rotation=30)
plt.show()
plt.savefig('a.png')

注意:我还有数据列a(X轴变量)的形式。
u' 2016-02-29T00:01:30.000Z CHEPSTLC0007143 CDC-R114-DK'

这导致了错误invalid literal for float()。这就是我使用plt.xticks(range(len(a)), a)的原因。

3个回答

4
这是一个mpl正按照您所说的去做的例子,但您说的内容有点不方便。
plt.xticks(range(len(a)), a)

这句话告诉mpl在每个整数处打上一个刻度,并使用a中的字符串来标记刻度(这一点它做得很正确)。我认为,您想要做的是:

import matplotlib.pyplot as plt
import matplotlib.ticker as mticker

# synthetic data
a = list(range(45))
d = ['the label {}'.format(i) for i in range(45)]

# make figure + axes
fig, ax = plt.subplots(tight_layout=True)
ax.set_xlabel('x label')
ax.set_ylabel('y label')

# draw one line
ln1, = ax.plot(range(45), lw=4, color='r')


# helper function for the formatter
def listifed_formatter(x, pos=None):
    try:
        return d[int(x)]
    except IndexError:
        return ''

# make and use the formatter
mt = mticker.FuncFormatter(listifed_formatter)
ax.xaxis.set_major_formatter(mt)

# set the default ticker to only put ticks on the integers
loc = ax.xaxis.get_major_locator()
loc.set_params(integer=True)

# rotate the labels
[lab.set_rotation(30) for lab in ax.get_xticklabels()]

示例输出

如果您进行平移/缩放,刻度标签将是正确的,并且mpl会选择显示合理数量的刻度。

[顺便说一句,此输出来自2.x分支,并显示了一些新的默认样式]


1

只需将plt.xticks(range(len(a)), a)替换为plt.xticks(np.arange(0, len(a) + 1, 5)),您就可以减少显示的x轴标签数量。


0
如果您想只显示3个勾号,请使用以下代码:
axes = plt.axes()
x_values = axes.get_xticks()
y_values = axes.get_yticks()

x_len = len(x_values)
y_len = len(y_values)
print(x_len)
print(y_len)

new_x = [x_values[i] for i in [0, x_len // 2, -1]]
new_y = [y_values[i] for i in [0, y_len // 2, -1]]

axes.set_xticks(new_x)
axes.set_yticks(new_y)

同样地,如果你只想显示25个刻度,只需从你的get_xticks()中选择等间距的25个值即可。


网页内容由stack overflow 提供, 点击上面的
可以查看英文原文,
原文链接