我已经按照这个教程https://www.youtube.com/watch?v=QIUxPv5PJOY预测了苹果公司未来一天的股票价格。代码如下:
#Import the libraries
import math
import pandas_datareader as web
import numpy as np
import pandas as pd
from sklearn.preprocessing import MinMaxScaler
from keras.models import Sequential
from keras.layers import Dense, LSTM
import matplotlib.pyplot as plt
plt.style.use('fivethirtyeight')
#Get the stock quote
df = web.DataReader('AAPL', data_source='yahoo', start='2012-01-01', end='2020-12-07')
#Show the data
df
#Get the number of rows and columns in the data set
df.shape
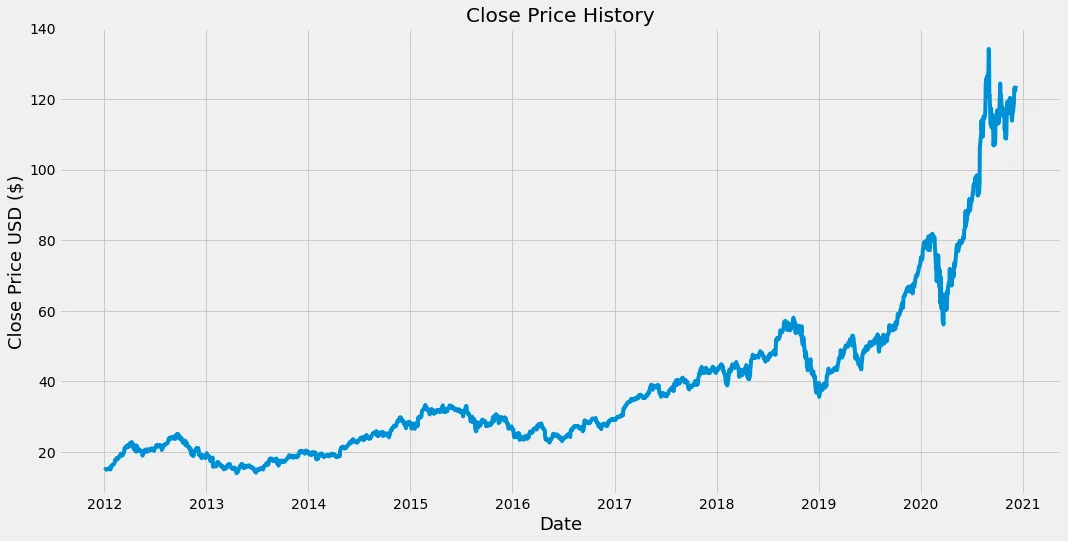
#Visualize the closing price history
#We create a plot with name 'Close Price History'
plt.figure(figsize=(16,8))
plt.title('Close Price History')
#We give the plot the data (the closing price of our stock)
plt.plot(df['Close'])
#We label the axis
plt.xlabel('Date', fontsize=18)
plt.ylabel('Close Price USD ($)', fontsize=18)
#We show the plot
plt.show()
#Create a new dataframe with only the 'Close' column
data = df.filter(['Close'])
#Convert the dataframe to a numpy array
dataset = data.values
#Get the number of rows to train the model on
training_data_len = math.ceil( len(dataset) * 0.8 )
training_data_len
#Scale the data
scaler = MinMaxScaler(feature_range=(0,1))
scaled_data = scaler.fit_transform(dataset)
scaled_data
#Create the training data set
#Create the scaled training data set
train_data = scaled_data[0:training_data_len, :]
#Split the data into x_train and y_train data sets
x_train = []
y_train = []
#We create a loop
for i in range(60, len(train_data)):
x_train.append(train_data[i-60:i, 0]) #Will conaint 60 values (0-59)
y_train.append(train_data[i, 0]) #Will contain the 61th value (60)
if i <= 60:
print(x_train)
print(y_train)
print()
#Convert the x_train and y_train to numpy arrays
x_train, y_train = np.array(x_train), np.array(y_train)
#Reshape the data
x_train = np.reshape(x_train, (x_train.shape[0], x_train.shape[1], 1))
x_train.shape
#Build the LSTM model
model = Sequential()
model.add(LSTM(50, return_sequences=True, input_shape=(x_train.shape[1], 1)))
model.add(LSTM(50, return_sequences=False))
model.add(Dense(25))
model.add(Dense(1))
#Compile the model
model.compile(optimizer='adam', loss='mean_squared_error')
#Train the model
model.fit(x_train, y_train, batch_size=1, epochs=1)
#Create the testing data set
#Create a new array containing scaled values from index 1738 to 2247
test_data = scaled_data[training_data_len - 60:]
#Create the data set x_test and y_test
x_test = []
y_test = dataset[training_data_len:, :]
for i in range(60, len(test_data)):
x_test.append(test_data[i-60:i, 0])
#Convert the data to a numpy array
x_test = np.array(x_test)
#Reshape the data
x_test = np.reshape(x_test, (x_test.shape[0], x_test.shape[1], 1))
#Get the model's predicted price values for the x_test data set
predictions = model.predict(x_test)
predictions = scaler.inverse_transform(predictions)
predictions
#Evaluate model (get the root mean quared error (RMSE))
rmse = np.sqrt( np.mean( predictions - y_test )**2 )
rmse
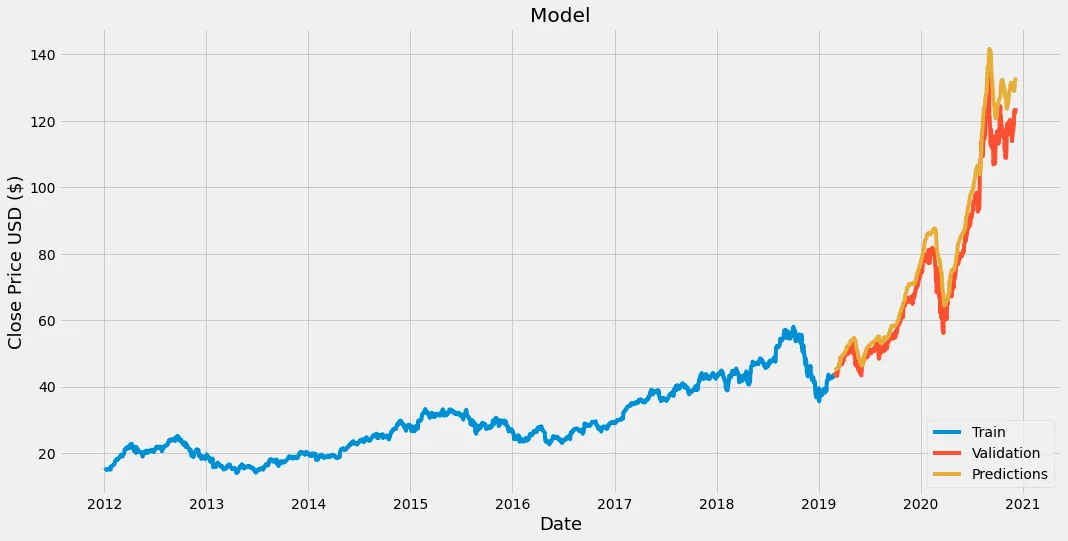
#Plot the data
train = data[:training_data_len]
valid = data[training_data_len:]
valid['Predictions'] = predictions
#Visualize the data
plt.figure(figsize=(16,8))
plt.title('Model')
plt.xlabel('Date', fontsize=18)
plt.ylabel('Close Price USD ($)', fontsize=18)
plt.plot(train['Close'])
plt.plot(valid[['Close', 'Predictions']])
plt.legend(['Train', 'Validation', 'Predictions'], loc='lower right')
plt.show()