我遇到了同样的问题,并在比较CCD星星观察图表中找到了解决方案,基本思路是找到两组点的三角形的最佳匹配。
然后我使用astroalign软件包计算变换矩阵,并将其对齐到所有点。感谢上帝,它运行得非常好。
import itertools
import numpy as np
import matplotlib.pyplot as plt
import astroalign as aa
def getTriangles(set_X, X_combs):
"""
Inefficient way of obtaining the lengths of each triangle's side.
Normalized so that the minimum length is 1.
"""
triang = []
for p0, p1, p2 in X_combs:
d1 = np.sqrt((set_X[p0][0] - set_X[p1][0]) ** 2 +
(set_X[p0][1] - set_X[p1][1]) ** 2)
d2 = np.sqrt((set_X[p0][0] - set_X[p2][0]) ** 2 +
(set_X[p0][1] - set_X[p2][1]) ** 2)
d3 = np.sqrt((set_X[p1][0] - set_X[p2][0]) ** 2 +
(set_X[p1][1] - set_X[p2][1]) ** 2)
d_min = min(d1, d2, d3)
d_unsort = [d1 / d_min, d2 / d_min, d3 / d_min]
triang.append(sorted(d_unsort))
return triang
def sumTriangles(ref_triang, in_triang):
"""
For each normalized triangle in ref, compare with each normalized triangle
in B. find the differences between their sides, sum their absolute values,
and select the two triangles with the smallest sum of absolute differences.
"""
tr_sum, tr_idx = [], []
for i, ref_tr in enumerate(ref_triang):
for j, in_tr in enumerate(in_triang):
tr_diff = abs(np.array(ref_tr) - np.array(in_tr))
tr_sum.append(sum(tr_diff))
tr_idx.append([i, j])
tr_idx_min = tr_idx[tr_sum.index(min(tr_sum))]
ref_idx, in_idx = tr_idx_min[0], tr_idx_min[1]
print("Smallest difference: {}".format(min(tr_sum)))
return ref_idx, in_idx
set_ref = np.array([[2511.268821,44.864124],
[2374.085032,201.922566],
[1619.282942,216.089335],
[1655.866502,221.127787],
[ 804.171659,2133.549517], ])
set_in = np.array([[1992.438563,63.727282],
[2285.793346,255.402548],
[1568.915358, 279.144544],
[1509.720134, 289.434629],
[1914.255205, 349.477788],
[2370.786382, 496.026836],
[ 482.702882, 508.685952],
[2089.691026, 523.18825 ],
[ 216.827439, 561.807396],
[ 614.874621, 2007.304727],
[1286.639124, 2155.264827],
[ 729.566116, 2190.982364]])
ref_combs = list(itertools.combinations(range(len(set_ref)), 3))
in_combs = list(itertools.combinations(range(len(set_in)), 3))
ref_triang, in_triang = getTriangles(set_ref, ref_combs), getTriangles(set_in, in_combs)
ref_idx, in_idx = sumTriangles(ref_triang, in_triang)
ref_idx_pts, in_idx_pts = ref_combs[ref_idx], in_combs[in_idx]
print ('triangle ref %s matches triangle in %s' % (ref_idx_pts, in_idx_pts))
print ("ref:", [set_ref[_] for _ in ref_idx_pts])
print ("input:", [set_in[_] for _ in in_idx_pts])
ref_pts = np.array([set_ref[_] for _ in ref_idx_pts])
in_pts = np.array([set_in[_] for _ in in_idx_pts])
transf, (in_list,ref_list) = aa.find_transform(in_pts, ref_pts)
transf_in = transf(set_in)
print(f'transformation matrix: {transf}')
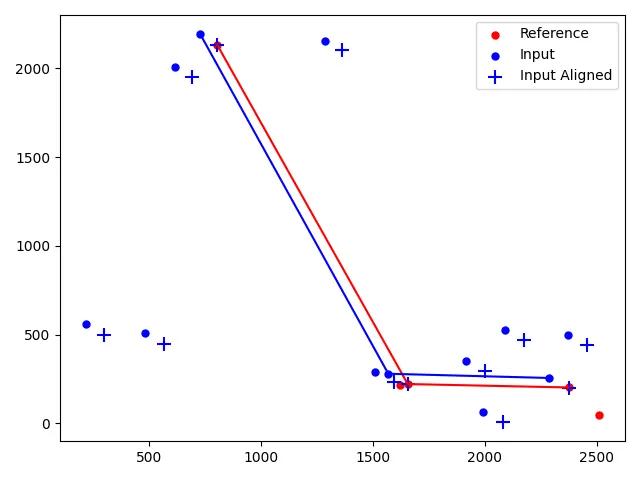
plt.scatter(set_ref[:,0],set_ref[:,1], s=100,marker='.', c='r',label='Reference')
plt.scatter(set_in[:,0],set_in[:,1], s=100,marker='.', c='b',label='Input')
plt.scatter(transf_in[:,0],transf_in[:,1], s=100,marker='+', c='b',label='Input Aligned')
plt.plot(ref_pts[:,0],ref_pts[:,1], c='r')
plt.plot(in_pts[:,0],in_pts[:,1], c='b')
plt.legend()
plt.tight_layout()
plt.savefig( 'align_coordinates.png', format = 'png')
plt.show()