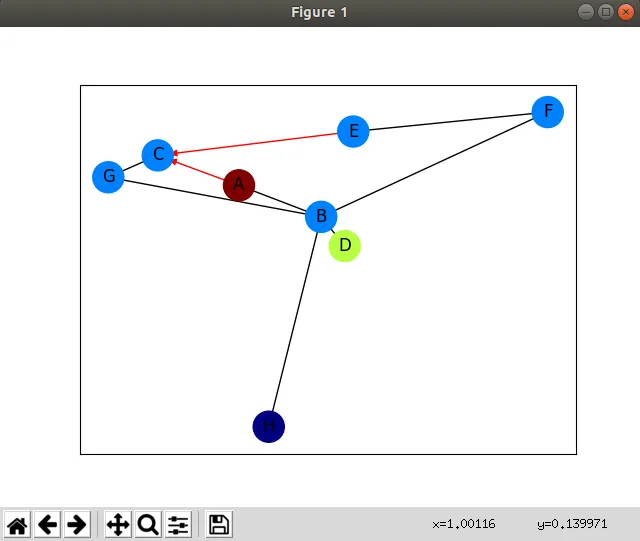
嗨,我正在尝试使用networkx和matplotlib绘制图形,但是尽管将轴设为“on”,并添加了x/y轴的极限值,但我的x和y轴仍未显示。
我尝试实施其他人的代码以查看轴是否会显示,但没有运气。
import networkx as nx
import matplotlib.pyplot as plt

G = nx.DiGraph()
G.add_edges_from(
        [('A', 'B'), ('A', 'C'), ('D', 'B'), ('E', 'C'), ('E', 'F'),
         ('B', 'H'), ('B', 'G'), ('B', 'F'), ('C', 'G')])

val_map = {'A': 1.0,
               'D': 0.5714285714285714,
               'H': 0.0}

values = [val_map.get(node, 0.25) for node in G.nodes()]

# Specify the edges you want here
red_edges = [('A', 'C'), ('E', 'C')]
edge_colours = ['black' if not edge in red_edges else 'red'
                    for edge in G.edges()]
black_edges = [edge for edge in G.edges() if edge not in red_edges]

# Need to create a layout when doing
# separate calls to draw nodes and edges
pos = nx.spring_layout(G)
nx.draw_networkx_nodes(G, pos, cmap=plt.get_cmap('jet'),
node_color = values, node_size = 500)
nx.draw_networkx_labels(G, pos)
nx.draw_networkx_edges(G, pos, edgelist=red_edges, edge_color='r', arrows=True)
nx.draw_networkx_edges(G, pos, edgelist=black_edges, arrows=False)
plt.show()
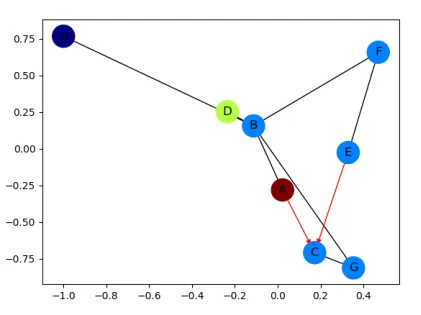
以下是另一个线程中的一些示例代码:如何在Python中使用NetworkX绘制有向图?
我甚至尝试了他/她提供的代码,但我从他的截图中可以看到他能够显示轴,但在我的端上却没有任何显示。
 没有错误信息。