我将matplotlib或prettyplotlib图形的尺寸设置为大号。例如,假设尺寸为80高度×80宽度。
然而,对于绘图标题、x轴和y轴标签(即点标签2014-12-03和坐标轴标签[年份月份]),文字大小变得非常小,以至于无法阅读。
如何增加这些文本标签的大小?目前我必须使用Web浏览器放大才能看到它们。
我将matplotlib或prettyplotlib图形的尺寸设置为大号。例如,假设尺寸为80高度×80宽度。
然而,对于绘图标题、x轴和y轴标签(即点标签2014-12-03和坐标轴标签[年份月份]),文字大小变得非常小,以至于无法阅读。
如何增加这些文本标签的大小?目前我必须使用Web浏览器放大才能看到它们。
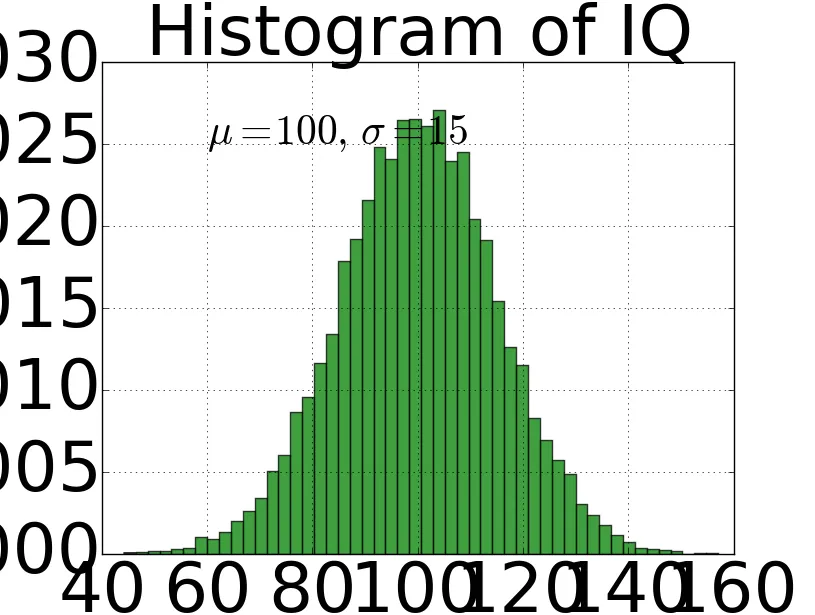
size 属性:
import matplotlib.pyplot as plt
plt.xlabel('my x label', size = 20)
plt.ylabel('my y label', size = 30)
plt.title('my title', size = 40)
plt.xticks(size = 50)
plt.yticks(size = 60)
例子:
import numpy as np
import matplotlib.pyplot as plt
mu, sigma = 100, 15
x = mu + sigma * np.random.randn(10000)
n, bins, patches = plt.hist(x, 50, normed=1, facecolor='g', alpha=0.75)
plt.xlabel('Smarts', size = 20)
plt.ylabel('Probability')
plt.title('Histogram of IQ', size = 50)
plt.text(60, .025, r'$\mu=100,\ \sigma=15$', size = 30)
plt.axis([40, 160, 0, 0.03])
plt.xticks(size = 50)
plt.yticks(size = 50)
plt.grid(True)
plt.show()
---------- 编辑 --------------
使用漂亮的绘图
fig, ax = plt.plot()
fig.suptitle('fig title', size = 80)
ax.set_title('my title', size = 10)
ax.set_xlabel('my x label', size = 20)
ax.set_ylabel('my y label', size = 30)
for tick in ax.xaxis.get_major_ticks():
    tick.label.set_fontsize(40)
for tick in ax.yaxis.get_major_ticks():
    tick.label.set_fontsize(50)
--------- 传说 --------------
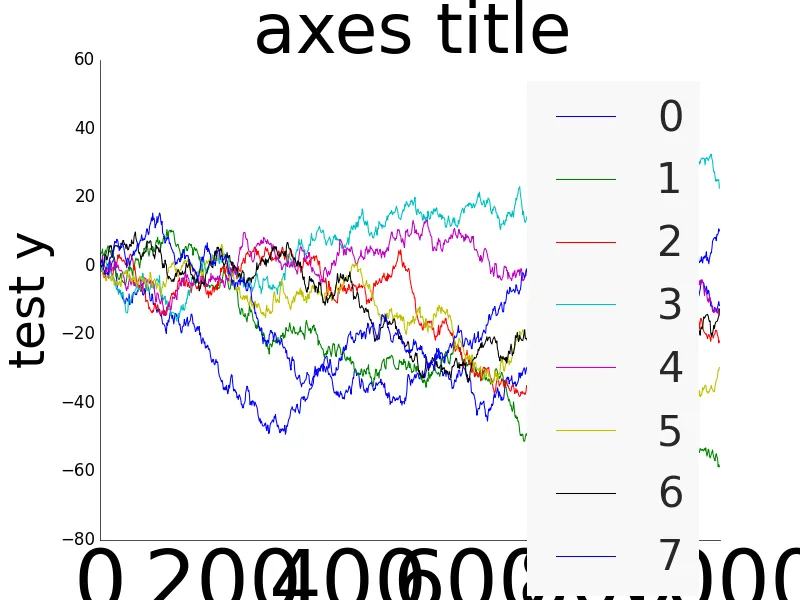
使用prop属性
ppl.legend(prop={'size':20})
plt.legend(prop={'size':20})
同样的命令...
例子:
import matplotlib.pyplot as plt
import matplotlib as mpl
from prettyplotlib import brewer2mpl
import numpy as np
import prettyplotlib as ppl
np.random.seed(12)
fig, ax = plt.subplots(1)
fig.suptitle('fig title', size = 80)
ax.set_title('axes title', size = 50)
for tick in ax.xaxis.get_major_ticks():
    tick.label.set_fontsize(60)
ax.set_ylabel("test y", size = 35)
for i in range(8):
    y = np.random.normal(size=1000).cumsum()
    x = np.arange(1000)
    ppl.plot(ax, x, y, label=str(i), linewidth=0.75)
ppl.legend(prop={'size':30})
fig.savefig('plot_prettyplotlib_default.png')
fig对象设置图形的标题: - João Paulofig.suptitle('axes title', size = 80)- João Paulo