我有一系列的数值,范围在-180到180之间。我需要一个以零为中心对称的颜色映射,也就是说,-180的颜色与180的值相同,依此类推。这是我第一次使用matplotlib,我找不到使其以零为中心对称的方法,负数总是有不同于正数的颜色。
非常感谢。
我有一系列的数值,范围在-180到180之间。我需要一个以零为中心对称的颜色映射,也就是说,-180的颜色与180的值相同,依此类推。这是我第一次使用matplotlib,我找不到使其以零为中心对称的方法,负数总是有不同于正数的颜色。
非常感谢。
感谢 https://dev59.com/eV0Z5IYBdhLWcg3wzC5W#31052741 的贡献。
import numpy as np
import matplotlib.pyplot as plt
import matplotlib.colors as mcolors


def symmetrical_colormap(cmap_settings, new_name = None ):
    ''' This function take a colormap and create a new one, as the concatenation of itself by a symmetrical fold.
    '''
    # get the colormap
    cmap = plt.cm.get_cmap(*cmap_settings)
    if not new_name:
        new_name = "sym_"+cmap_settings[0]  # ex: 'sym_Blues'

    # this defined the roughness of the colormap, 128 fine
    n= 128

    # get the list of color from colormap
    colors_r = cmap(np.linspace(0, 1, n))    # take the standard colormap # 'right-part'
    colors_l = colors_r[::-1]                # take the first list of color and flip the order # "left-part"

    # combine them and build a new colormap
    colors = np.vstack((colors_l, colors_r))
    mymap = mcolors.LinearSegmentedColormap.from_list(new_name, colors)

    return mymap
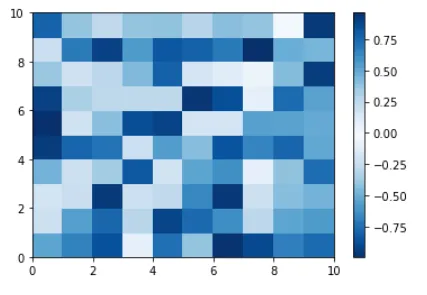
测试它会给你:
# --- Quick test -------------------------
cmap_settings = ('Blues', None)  # provide int instead of None to "discretize/bin" the colormap
mymap = symmetrical_colormap(cmap_settings= cmap_settings, new_name =None )

data = np.random.rand(10,10) * 2 - 1
plt.pcolor(data, cmap=mymap)
plt.colorbar()
plt.show()
虽然不完美,但离散颜色映射至少是居中的:
from matplotlib import pyplot as plt
<function using cmap>.(cmap=plt.get_cmap("PiYG"))
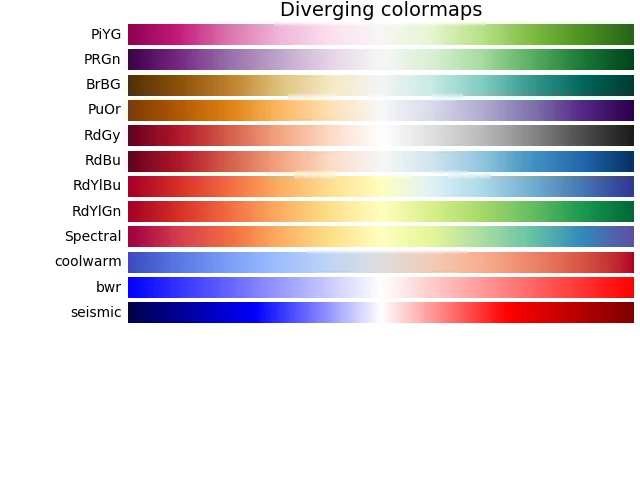