我有一些基于时间的数值,它们在10000和0之间循环(大约每天两次)。
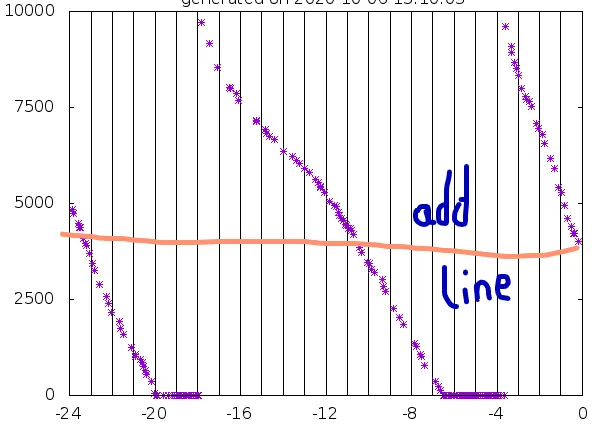
我已经绘制了图表,但我想要一个水平线从最后一个点开始,以便于参考。
我的数据(重复的列可以预期):
-23.7897222222222 4832
-23.7138888888889 4749
-23.7138888888889 4749
-23.5169444444444 4479
-23.4277777777778 4365
-23.4152777777778 4365
-23.2647222222222 4086
-23.1686111111111 3960
-23.1083333333333 3907
-23.1083333333333 3907
 ...
-0.777777777777778 4950
-0.777777777777778 4950
-0.6075 4601
-0.6075 4601
-0.421666666666667 4407
-0.334722222222222 4213
-0.284722222222222 4213
-0.284722222222222 4213
-0.112222222222222 3998
-0.112222222222222 3998
我的gnuplot脚本:
set terminal png
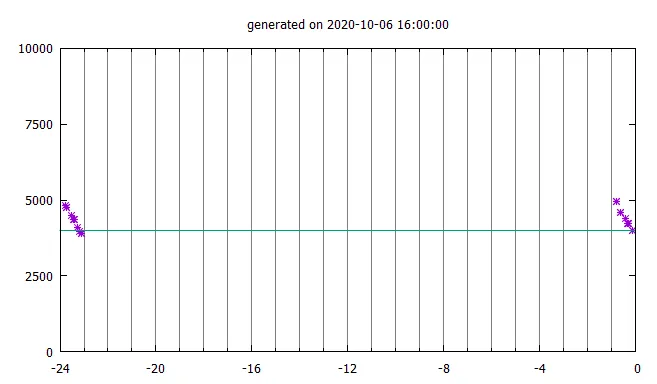
set title 'generated on 2020-10-06 16:00:00'
set xrange [-24:0]
set xtics -24, 4
set ytics 0, 2500
set output 'xxx.png'
set arrow from graph 0.042,0 to graph 0.042,1 nohead
set arrow from graph 0.083,0 to graph 0.083,1 nohead
set arrow from graph 0.125,0 to graph 0.125,1 nohead
set arrow from graph 0.167,0 to graph 0.167,1 nohead
set arrow from graph 0.208,0 to graph 0.208,1 nohead
set arrow from graph 0.250,0 to graph 0.250,1 nohead
set arrow from graph 0.292,0 to graph 0.292,1 nohead
set arrow from graph 0.333,0 to graph 0.333,1 nohead
set arrow from graph 0.375,0 to graph 0.375,1 nohead
set arrow from graph 0.417,0 to graph 0.417,1 nohead
set arrow from graph 0.458,0 to graph 0.458,1 nohead
set arrow from graph 0.500,0 to graph 0.500,1 nohead
set arrow from graph 0.542,0 to graph 0.542,1 nohead
set arrow from graph 0.583,0 to graph 0.583,1 nohead
set arrow from graph 0.625,0 to graph 0.625,1 nohead
set arrow from graph 0.667,0 to graph 0.667,1 nohead
set arrow from graph 0.708,0 to graph 0.708,1 nohead
set arrow from graph 0.750,0 to graph 0.750,1 nohead
set arrow from graph 0.792,0 to graph 0.792,1 nohead
set arrow from graph 0.834,0 to graph 0.834,1 nohead
set arrow from graph 0.875,0 to graph 0.875,1 nohead
set arrow from graph 0.917,0 to graph 0.917,1 nohead
set arrow from graph 0.958,0 to graph 0.958,1 nohead
plot 'xxx.dat' notitle with points pt 3
我的(预期)结果: