ggplot:重新调整轴(对数)并截断轴

3

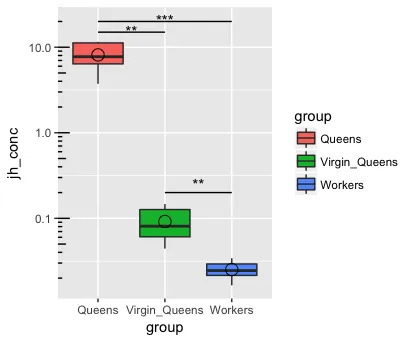
我想在R中绘制一个非常简单的箱线图,像这样:
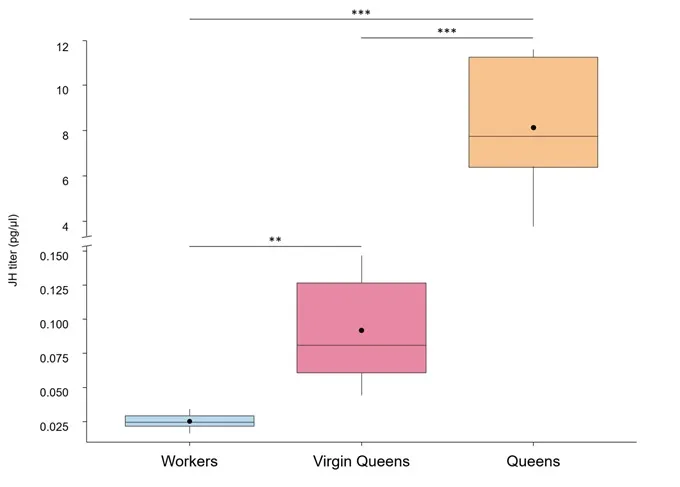
期望的图表

enter image description here

这是一个连续依赖变量(jh_conc是激素浓度变量)的对数链接(伽玛分布的)广义线性模型,针对分类分组变量(group:蜜蜂类型

我已经有的脚本是:

> jh=read.csv("data_jh_titer.csv",header=T)
> jh
           group     jh_conc
1         Queens  6.38542714
2         Queens 11.22512563
3         Queens  7.74472362
4         Queens 11.56834171
5         Queens  3.74020100
6  Virgin Queens  0.06080402
7  Virgin Queens  0.12663317
8  Virgin Queens  0.08090452
9  Virgin Queens  0.04422111
10 Virgin Queens  0.14673367
11       Workers  0.03417085
12       Workers  0.02449749
13       Workers  0.02927136
14       Workers  0.01648241
15       Workers  0.02150754

fit1=glm(jh_conc~group,family=Gamma(link=log), data=jh) 

ggplot(fit, aes(group, jh_conc))+
      geom_boxplot(aes(fill=group))+
      coord_trans(y="log")
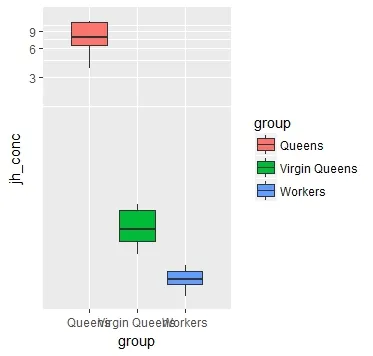
生成的图表如下所示:

enter image description here

我的问题是:我可以使用哪些(geom)扩展来分割y轴并以不同比例重新调整它们?另外,我如何添加黑色圆圈(平均值;这些平均值是在对数尺度上计算然后转换回原始尺度的)水平线,其基于对数变换数据执行的事后测试的显着性水平为:**:p<0.01,***:p<0.001?
1个回答

3
您无法在ggplot2中创建一个损坏的数值轴,这是出于设计考虑,主要是因为它会视觉上扭曲数据/表示的差异,并被认为是误导性的。但是,您可以使用scale_log10() + annotation_logticks()来帮助压缩跨越广泛数值范围的数据或更好地显示异方差数据。您还可以使用annotate构建您的P-值表示星号和条形图。此外,您可以使用命名属性轻松地从模型中获取信息,这里我们关心的是fit$coef
# make a zero intercept version for easy plotting
fit2 <- glm(jh_conc ~ 0 + group, family = Gamma(link = log), data = jh)
# extract relevant group means and use exp() to scale back
means <- data.frame(group = gsub("group", "",names(fit2$coef)), means = exp(fit2$coef))

ggplot(fit, aes(group, jh_conc)) +
    geom_boxplot(aes(fill=group)) +
    # plot the circles from the model extraction (means)
    geom_point(data = means, aes(y = means),size = 4, shape = 21, color = "black", fill = NA) +
    # use this instead of coord_trans
    scale_y_log10() + annotation_logticks(sides = "l") +
    # use annotate "segment" to draw the horizontal lines
    annotate("segment", x = 1, xend = 2, y = 15, yend = 15) +
    # use annotate "text" to add your pvalue *'s
    annotate("text", x = 1.5, y = 15.5, label = "**", size = 4) +
    annotate("segment", x = 1, xend = 3, y = 20, yend = 20) +
    annotate("text", x = 2, y = 20.5, label = "***", size = 4) +
    annotate("segment", x = 2, xend = 3, y = .2, yend = .2) +
    annotate("text", x = 2.5, y = .25, label = "**", size = 4) 

enter image description here


网页内容由stack overflow 提供, 点击上面的
可以查看英文原文,
原文链接