有没有一种方法可以将ListPlot的图形与Plot的图形结合起来?(我需要在一个ListPlot的图形上绘制一个函数的图形)
如何将ListPlot的图形与Plot的图形结合起来?
13
- BlackShadow
1
2个回答
18
你可以像下面这样使用Show函数将任何图形组合在一起:
Show[myListPlot, myPlot]
这可以泛化为同时组合任意数量的图形:Show[p1, p2, p3, p4, ...] 或 Show[{p1,p2,p3,p4,...}]
参考和图片来源:http://reference.wolfram.com/mathematica/ref/Show.html

如果使用Show时不能正确堆叠图形,也可以使用Epilog,但是使用Epilog组合超过2个图形会变得笨重。
- ninjagecko
4
2我不理解你最后一行的意思...能否解释一下为什么“Epilog”过于复杂或者你所说的“堆叠顺序”的含义是什么? - user564376
1你应该将评论发布到其他答案的评论区,原因有很多,其中不太重要的是当前的答案可能会在未来被删除,而其他答案则可能会被发布。 - Dr. belisarius
@d00b:如果你查看文档,Epilog的明确目的是在第一个图形生成后在顶部渲染一个图形(例如允许叠加和遮罩和水印),而Show的目的是将2D和3D图形(如点、线和曲面)组合在一起。此外,如果你希望组合超过2个图形,Epilog会变得非常笨重。每个都有其适用的时间和地点。 - ninjagecko
谢谢。那么为什么 MMA文档在多个地方使用
Epilog来叠加绘图呢?一个例子是在Histogram下的应用程序中。 - user5643769
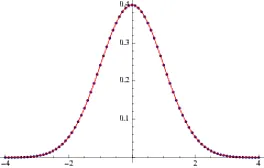
从你的第二行开始,我认为你要找的是Epilog。以下是一个例子:
f[x_] := 1/Sqrt[2 Pi] Exp[-(x^2)/2];
ListPlot[
 Table[
  {x, PDF[NormalDistribution[], x]}, {x, -4, 4, 0.1}
  ],
 Epilog -> First@Plot[f[x], {x, -4, 4}, PlotStyle -> Red]
 ]
另一种做法是使用 Show
p1 = ListPlot[
   Table[
    {x, PDF[NormalDistribution[], x]}, {x, -4, 4, 0.1}
    ]
   ];
p2 = Plot[f[x], {x, -4, 4}, PlotStyle -> Red];
Show[p1,p2]
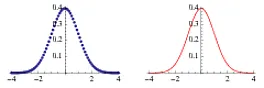
另一方面,如果我误解了你的意思,你只是想将它们并排放置,那么你可以使用GraphicsRow或GraphicsColumn。
FullGraphics@GraphicsRow[{p1, p2}]
- user616736
网页内容由stack overflow 提供, 点击上面的可以查看英文原文,
原文链接
原文链接
Fit[]的帮助文档中有许多好的例子,可供参考:http://reference.wolfram.com/mathematica/ref/Fit.html。 - Dr. belisarius