ListPlot:个别点颜色

4
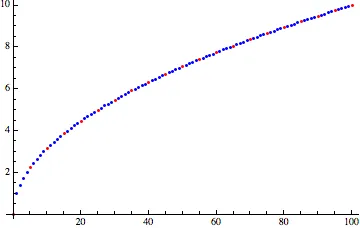
我有一个简单的ListPlot,如下所示:
list2 = Table[{x, Sqrt[x]}, {x, 0, 100}];

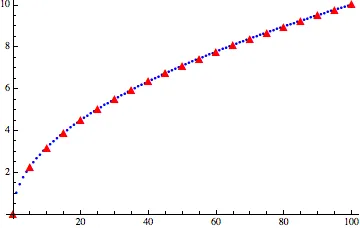
现在我想用红色标出特定的点,例如每5个点标一个红点,我尝试过用以下代码:
mycolor[x_] /; Mod[x, 5] == 0 = Red;
mycolor[_] = Blue;

现在
ListPlot[#, PlotStyle -> AbsolutePointSize[3], ColorFunction -> 
mycolor[#[[All, 1]], ColorFunctionScaling -> False]] &[list2]

无法正常工作,所有点仍然是蓝色。这里出了什么问题?

谢谢, archi


1
http://mathematica.stackexchange.com/questions/1300/listplot-with-each-point-a-different-color-and-a-legend-bar - agentp
1个回答

3
这里有一个简单的方法可以帮助您获得想要的结果:-
list2 = Table[{x, Sqrt[x]}, {x, 0, 100}];
mycolor[x_] := If[Mod[x, 5] == 0, Red, Blue];
mycolors = mycolor /@ list2[[All, 1]];
ListPlot[List /@ list2,
 PlotStyle -> Map[{AbsolutePointSize[3], #} &, mycolors]]

enter image description here

或者,通过颜色函数实现,感谢rm -rf在George的链接中的回答

list2 = Table[{x, Sqrt[x]}, {x, 0, 100}];
mycolor = Function[{x, y}, If[Mod[x, 5] == 0, Red, Blue]];
ListLinePlot[list2,
  PlotStyle -> AbsolutePointSize[3], ColorFunction -> mycolor, 
  ColorFunctionScaling -> False] /. Line -> Point

进一步评论

对于不同的绘图标记,我已经采用了简单的方法。为了在ListPlot中应用不同的样式和绘图标记,不同样式的点必须在单独的列表中,因此使用 List /@ list2。(虽然只需要两个列表。)

Clear[mycolor];
list2 = Table[{x, Sqrt[x]}, {x, 0, 100}];
mycolor[x_] := If[Mod[x, 5] == 0,
   {Red, "\[FilledUpTriangle]", 14},
   {Blue, "\[FilledSmallCircle]", 6}];
mycolorspec = mycolor /@ First /@ list2;
ListPlot[List /@ list2,
 PlotMarkers -> Apply[Style[#2, FontSize -> #3, #1] &,
   mycolorspec, {1}]]

enter image description here


谢谢Chris!第一个解决方案对我来说看起来有点神秘;) mycolors = mycolor /@ list2[[All, 1]]; 映射到list2中所有元素的Mod条件。但是为什么要有List /@ list2?我先尝试了ColorFunction,但没有成功。似乎诀窍是用List[Line]Plot代替ListPlot,然后告诉它用/. Line -> Point来绘制点... - archi pelago
还有一个问题:我如何给所有红点另一个PlotMarker,比如“FilledUpTriange”? 谢谢, archi - archi pelago
@archipelago - 关于ListLinePlot,是的,正如rm -rf points out,单独使用ListPlot无法捕捉到颜色函数。 - Chris Degnen

网页内容由stack overflow 提供, 点击上面的
可以查看英文原文,
原文链接