Mathematica中的Manipulate函数无法显示Plot图形

5

我最初试图使用Plot3D和Manipulate滑块(其中两个参数由滑块控制,另一个在“x-y”平面中变化)来可视化一个具有4个参数的函数。然而,当我的非绘图参数由Manipulate控制时,我没有得到任何输出?

下面的1d绘图示例复制了我在更复杂的绘图尝试中看到的情况:

Clear[g, mu]
g[ x_] = (x Sin[mu])^2 
Manipulate[ Plot[ g[x], {x, -10, 10}], {{mu, 1}, 0, 2 \[Pi]}] 
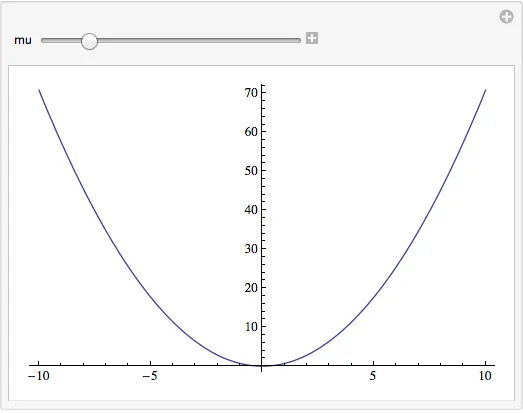
Plot[ g[x] /. mu -> 1, {x, -10, 10}] 

当mu的值固定时,选择{0,70}的默认区间后,图表会呈现预期的抛物线输出,而Manipulate交互式操作在{0,1}区间内无输出。

我怀疑在使用mu滑块控制时没有选择好默认的PlotRange,但是手动添加一个PlotRange同样没有输出:

Manipulate[ Plot[ g[x], {x, -10, 10}, PlotRange -> {0, 70}], {{mu, 1}, 0, 2 \[Pi]}]
2个回答

9

这是因为Manipulate参数是局部的。

Manipulate[ Plot[ g[x], {x, -10, 10}], {{mu, 1}, 0, 2 \[Pi]}]中的mu与您在前一行清除的全局mu不同。

我建议使用

g[x_, mu_] := (x Sin[mu])^2
Manipulate[Plot[g[x, mu], {x, -10, 10}], {{mu, 1}, 0, 2 \[Pi]}]

以下方法也可以,但它会改变全局变量的值,如果不注意可能会在后面引起意想不到的问题,因此我不建议使用:
g[x_] := (x Sin[mu])^2
Manipulate[
 mu = mu2;
 Plot[g[x], {x, -10, 10}],
 {{mu2, 1}, 0, 2 \[Pi]}
]

有时候你可能会清空mu,但发现当滚动到视图中时,它会获得一个值。


谢谢,这很有效,而且对我原本尝试的四个参数绘图进行了泛化。 - Peeter Joot

2

另一种克服 Manipulate 本地化的方法是将函数放在 Manipulate[] 内部:

Manipulate[Module[{x,g},
  g[x_]=(x Sin[mu])^2;
  Plot[g[x], {x, -10, 10}]], {{mu, 1}, 0, 2 \[Pi]}]

甚至更多。
Manipulate[Module[{x,g},
  g=(x Sin[mu])^2;
  Plot[g, {x, -10, 10}]], {{mu, 1}, 0, 2 \[Pi]}]

以下两种方法都可以:

在 manipulate 中定义 g

Module[{x,g},...] 可以防止全局环境里的副作用,从而简化了对 g 的定义。在使用 Manipulate[] 绘制具有数十个可调参数的图形时,将所有这些参数作为函数参数传递可能会很繁琐。


网页内容由stack overflow 提供, 点击上面的
可以查看英文原文,
原文链接