关键在于将您的数据转换为矩阵(邻接矩阵,其中行对应“从”而列对应“到”)。
df = read.table(textConnection("
 Brand_from model_from Brand_to Model_to
      VOLVO        s80      BMW  5series
        BMW    3series      BMW  3series
      VOLVO        s60    VOLVO      s60
      VOLVO        s60    VOLVO      s80
        BMW    3series     AUDI       s4
       AUDI         a4      BMW  3series
       AUDI         a5     AUDI       a5
"), header = TRUE, stringsAsFactors = FALSE)

from = paste(df[[1]], df[[2]], sep = ",")
to = paste(df[[3]], df[[4]], sep = ",")

mat = matrix(0, nrow = length(unique(from)), ncol = length(unique(to)))
rownames(mat) = unique(from)
colnames(mat) = unique(to)
for(i in seq_along(from)) mat[from[i], to[i]] = 1
mat的值为:
> mat
            BMW,5series BMW,3series VOLVO,s60 VOLVO,s80 AUDI,s4 AUDI,a5
VOLVO,s80             1           0         0         0       0       0
BMW,3series           0           1         0         0       1       0
VOLVO,s60             0           0         1         1       0       0
AUDI,a4               0           1         0         0       0       0
AUDI,a5               0           0         0         0       0       1
然后将矩阵发送到
chordDiagram,并指定
order和
directional。手动指定
order是为了确保相同品牌被分组在一起。
par(mar = c(1, 1, 1, 1))
chordDiagram(mat, order = sort(union(from, to)), directional = TRUE)
circos.clear()
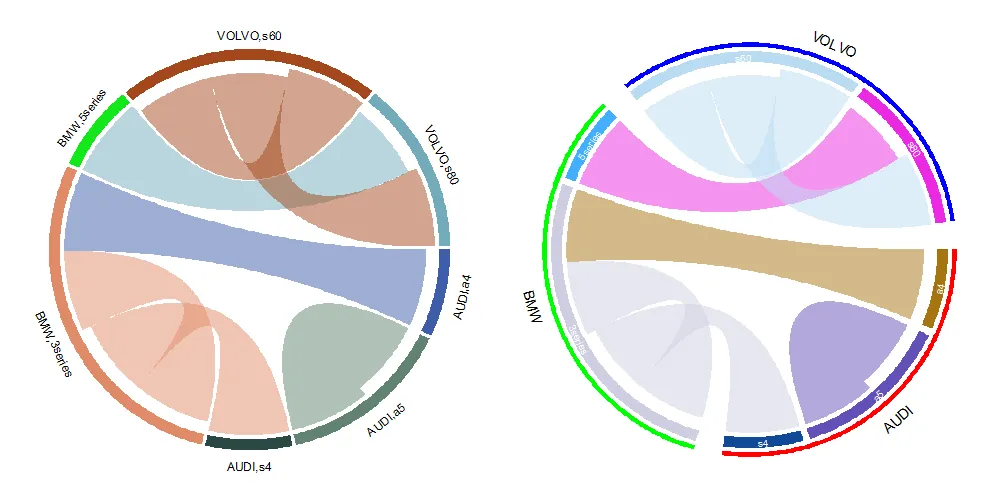
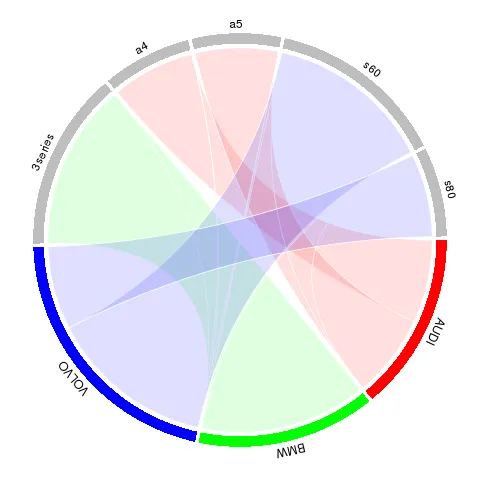
为了让图形更加复杂,您可以创建一个品牌名称的轨道、一个品牌识别的轨道、一个型号名称的轨道。此外,我们可以将品牌之间的间隔设置得比品牌内部的间隔大。
1 设置
gap.degree。
circos.par(gap.degree = c(2, 2, 8, 2, 8, 2, 8))
在绘制弦图之前,我们需要创建两个空轨道,一个用于品牌名称,另一个用于标识线,通过
preAllocateTracks参数实现。
par(mar = c(1, 1, 1, 1))
chordDiagram(mat, order = sort(union(from, to)),
    direction = TRUE, annotationTrack = "grid", preAllocateTracks = list(
        list(track.height = 0.02),
        list(track.height = 0.02))
)
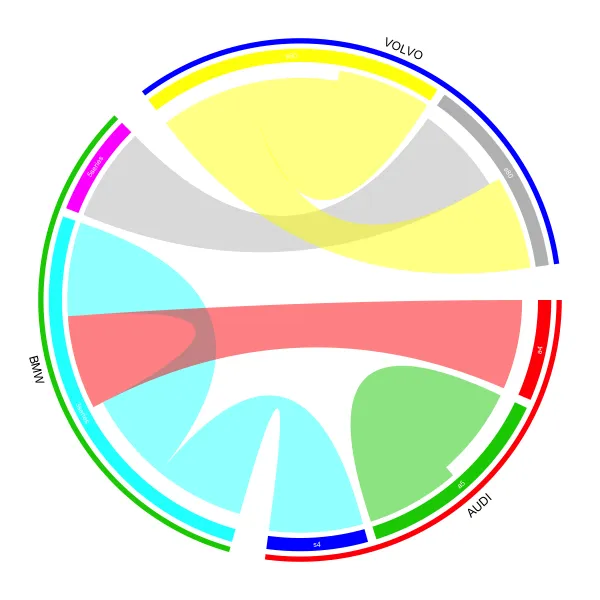
步骤3:将模型名称添加到注释轨道(该轨道默认创建,位于左右两个图中的粗轨道。请注意,这是从外向内数第三轨道)
circos.trackPlotRegion(track.index = 3, panel.fun = function(x, y) {
    xlim = get.cell.meta.data("xlim")
    ylim = get.cell.meta.data("ylim")
    sector.index = get.cell.meta.data("sector.index")
    model = strsplit(sector.index, ",")[[1]][2]
    circos.text(mean(xlim), mean(ylim), model, col = "white", cex = 0.8, facing = "inside", niceFacing = TRUE)
}, bg.border = NA)
4 添加品牌识别线。由于品牌涵盖多个行业,我们需要手动计算线(弧)的起始和结束度数。以下是第二轨道中rou1和rou2两个边框的高度。识别线绘制在第二轨道上。
all_sectors = get.all.sector.index()
rou1 = get.cell.meta.data("yplot", sector.index = all_sectors[1], track.index = 2)[1]
rou2 = get.cell.meta.data("yplot", sector.index = all_sectors[1], track.index = 2)[2]

start.degree = get.cell.meta.data("xplot", sector.index = all_sectors[1], track.index = 2)[1]
end.degree = get.cell.meta.data("xplot", sector.index = all_sectors[3], track.index = 2)[2]
draw.sector(start.degree, end.degree, rou1, rou2, clock.wise = TRUE, col = "red", border = NA)
首先在极坐标系中获取文本的坐标,然后通过reverse.circlize映射到数据坐标系中。请注意,映射坐标回来并绘制文本的单元格应该是相同的单元格。
m = reverse.circlize( (start.degree + end.degree)/2, 1, sector.index = all_sectors[1], track.index = 1)
circos.text(m[1, 1], m[1, 2], "AUDI", cex = 1.2, facing = "inside", adj = c(0.5, 0), niceFacing = TRUE,
    sector.index = all_sectors[1], track.index = 1)
对于另外两个品牌,代码相同。
start.degree = get.cell.meta.data("xplot", sector.index = all_sectors[4], track.index = 2)[1]
end.degree   = get.cell.meta.data("xplot", sector.index = all_sectors[5], track.index = 2)[2]
draw.sector(start.degree, end.degree, rou1, rou2, clock.wise = TRUE, col = "green", border = NA)
m = reverse.circlize( (start.degree + end.degree)/2, 1, sector.index = all_sectors[1], track.index = 1)
circos.text(m[1, 1], m[1, 2], "BMW", cex = 1.2, facing = "inside", adj = c(0.5, 0), niceFacing = TRUE,
    sector.index = all_sectors[1], track.index = 1)

start.degree = get.cell.meta.data("xplot", sector.index = all_sectors[6], track.index = 2)[1]
end.degree  = get.cell.meta.data("xplot", sector.index = all_sectors[7], track.index = 2)[2]
draw.sector(start.degree, end.degree, rou1, rou2, clock.wise = TRUE, col = "blue", border = NA)
m = reverse.circlize( (start.degree + end.degree)/2, 1, sector.index = all_sectors[1], track.index = 1)
circos.text(m[1, 1], m[1, 2], "VOLVO", cex = 1.2, facing = "inside", adj = c(0.5, 0), niceFacing = TRUE,
    sector.index = all_sectors[1], track.index = 1)

circos.clear()
如果你想设置颜色,请查看包vignette。如果需要,也可以使用circos.axis在图上添加坐标轴。
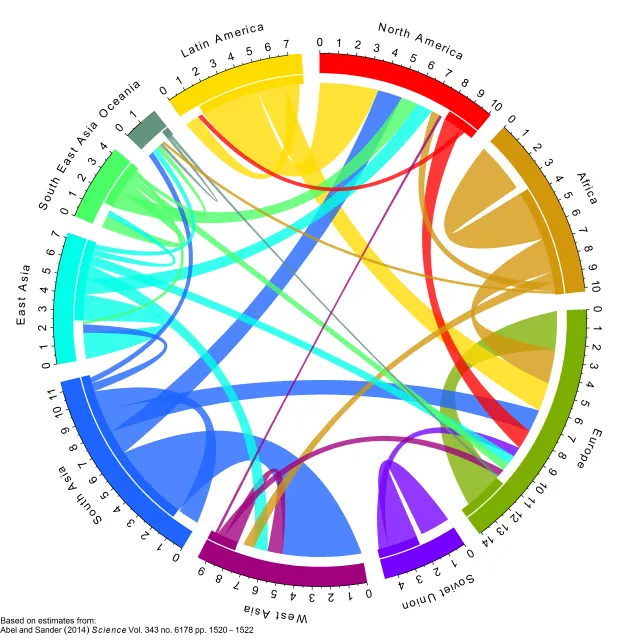
 期望的结果是像这个例子一样,但是替换了大洲我想要的是汽车品牌,在内圆中放置属于该品牌的汽车型号。
2:4和2:8是硬编码的,如果您使用自己的数据,则需要动态编码,例如model_color = structure(seq(2,length(names(brand))+1), names = names(brand))。 - JustinJDavies