目的
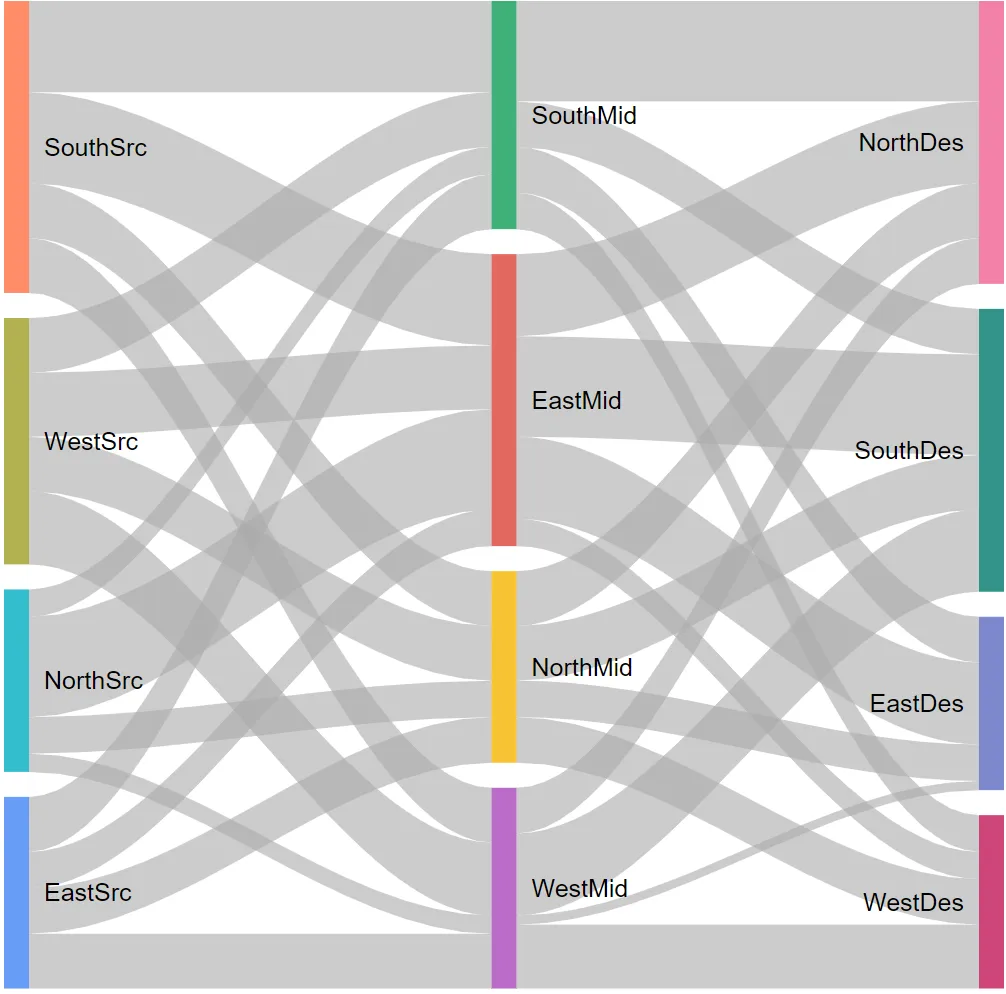
我打算使用googleVis软件包在R中制作多重桑基图。输出结果应该类似于这个:
数据
我在R中创建了一些虚拟数据:
set.seed(1)

source <- sample(c("North","South","East","West"),100,replace=T)
mid <- sample(c("North ","South ","East ","West "),100,replace=T)
destination <- sample(c("North","South","East","West"),100,replace=T) # N.B. It is important to have a space after the second set of destinations to avoid a cycle
dummy <- rep(1,100) # For aggregation

dat <- data.frame(source,mid,destination,dummy)
aggdat <- aggregate(dummy~source+mid+destination,dat,sum)
我已经尝试过的方法
如果只有起点和终点,我可以很好地构建具有两个变量的桑基图,但是如果涉及到中间节点,我就无法成功:
aggdat <- aggregate(dummy~source+destination,dat,sum)

library(googleVis)

p <- gvisSankey(aggdat,from="source",to="destination",weight="dummy")
plot(p)
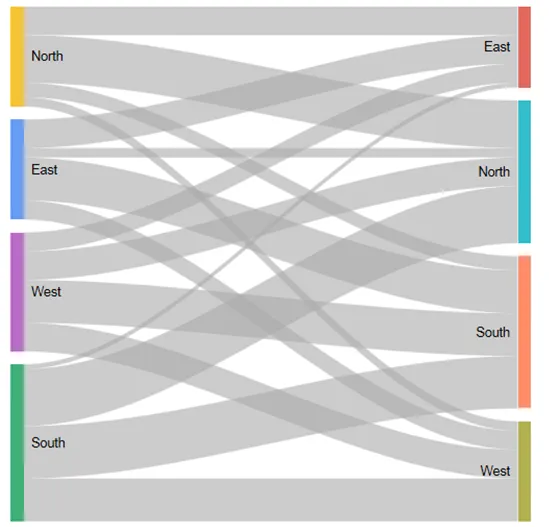
代码生成了以下内容:
问题
如何修改
p <- gvisSankey(aggdat,from="source",to="destination",weight="dummy")
需要接受 mid 变量吗?