如果您的图形是在R2014b或更新版本中生成的,则可以利用未记录的
'PlotChildren'属性来操纵图例条目的顺序,而无需进行新的
legend调用。
例如:
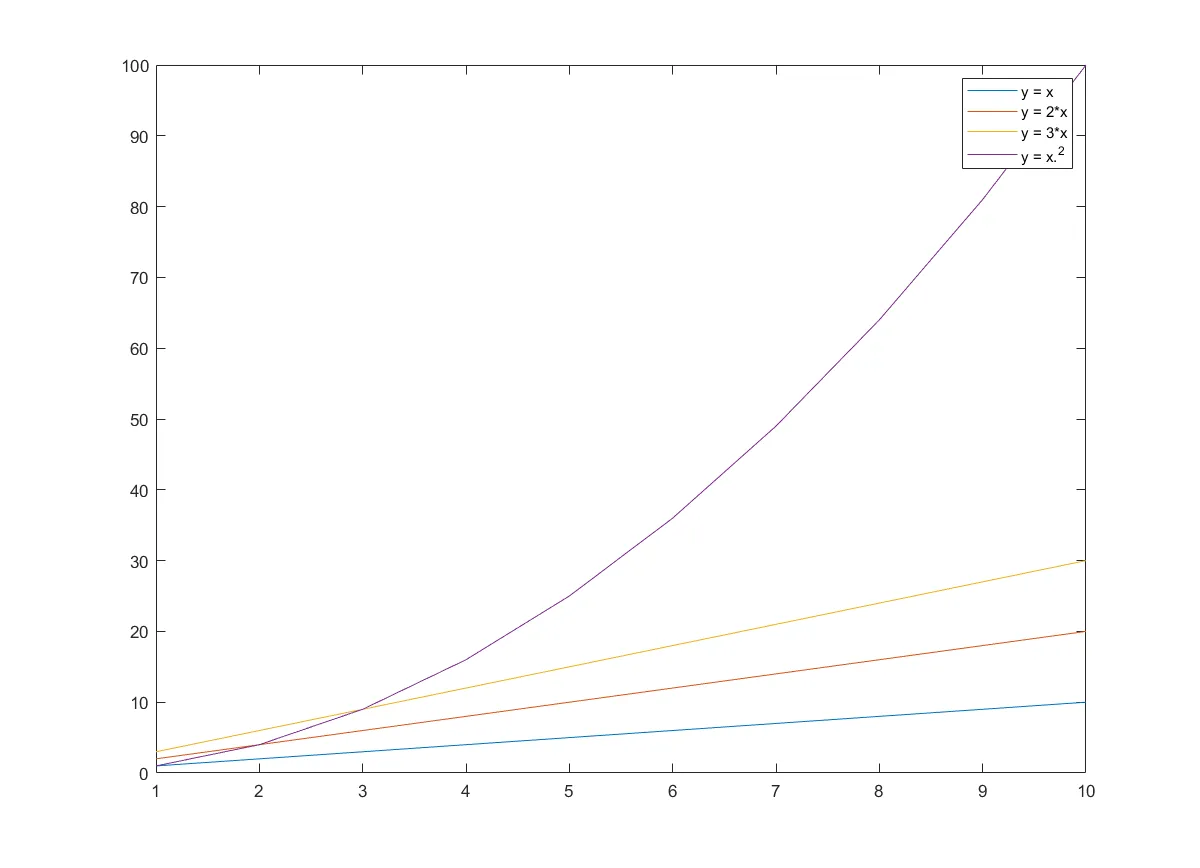
x = 1:10;
y1 = x;
y2 = 2*x;
y3 = 3*x;
y4 = x.^2;

plot(x, y1, x, y2, x, y3, x, y4);
lh = legend('y = x', 'y = 2*x', 'y = 3*x', 'y = x.^2');
产生:

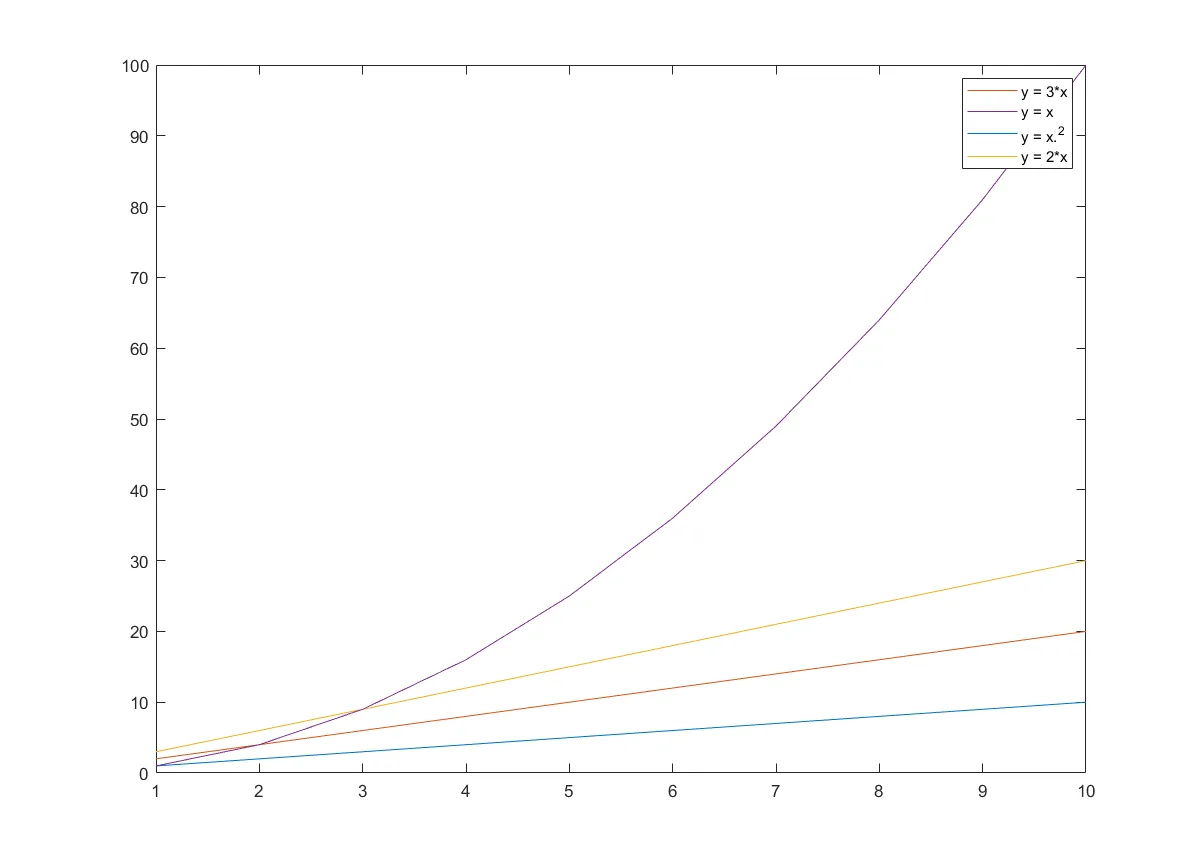
然后您可以进行操作:
neworder = [3, 1, 4, 2]
lh.PlotChildren = lh.PlotChildren(neworder)
生产:
如果您没有指向 legend 对象的句柄,那么它是包含您的数据绘制在上面的figure对象和axes对象的子级。 您可以使用以下任一 findobj 方法找到指向您的 legend 对象的句柄:
lg = findobj(figureobj, 'Type', 'legend');
lh = findobj(gcf, 'Type', 'legend');
请注意,
gcf一般返回用户单击的最后一个图形的句柄,但这并不总是这样。
< p > < em > 自我推广编辑 :这种方法包含在一组
由StackOverflow MATLAB社区维护的传奇操作工具中。