Matplotlib图例中项目的顺序是如何确定的?

112

我需要重新排列图例中的项,但我认为我不应该这样做。 我尝试了:

from pylab import *
clf()
ax=gca()
ht=ax.add_patch(Rectangle((1,1),1,1,color='r',label='Top',alpha=.1))
h1=ax.bar(1,2,label='Middle')
hb=ax.add_patch(Rectangle((1,1),1,1,color='k',label='Bottom',alpha=.11))
legend()
show()

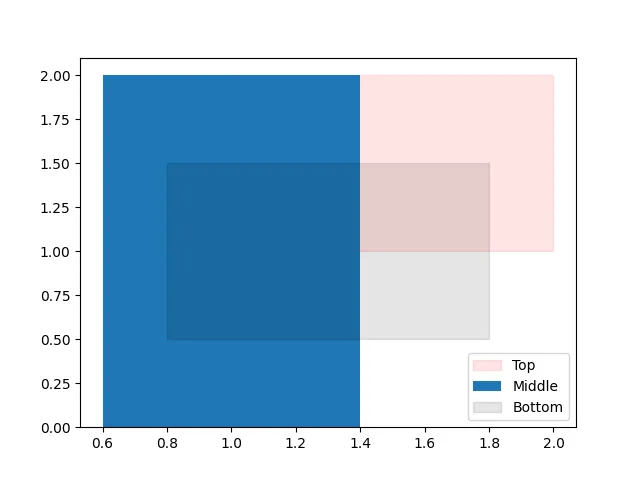
如何正确排列顺序?难道不是由创建顺序决定的吗?因为我最终得到了下面的顺序:底部在中间之上。

Code results in wrong legend item order

更新:可以使用以下代码强制排序。我认为这可能是最简单的方法,但看起来很笨拙。问题是什么决定了原始顺序呢?

hh=[ht,h1,hb]
legend([ht,h1.patches[0],hb],[H.get_label() for H in hh])

这个有帮助吗?http://matplotlib.org/users/legend_guide.html#adjusting-the-order-of-legend-items - Jeff
谢谢。我已经在问题中添加了一种强制顺序的方法,但这很笨拙,问题是如何使其不必要(如果可能的话)。我想我必须接受一个答案,即顺序未记录/未确定,如果情况是这样的话。 - CPBL
7个回答

118

在其他答案的基础上稍作变化。列表order的长度应与图例项的数量相同,并手动指定新的顺序。

handles, labels = plt.gca().get_legend_handles_labels()
order = [0,2,1]
plt.legend([handles[idx] for idx in order],[labels[idx] for idx in order])

12
优秀回答:短代码完全排序灵活性。为了更易于理解,需要说明一下,顺序向量中的数字是标签的旧位置,而向量中的插槽是新位置:“order=[0,2,1]”表示第一个标签“0”仍然在第一个位置,“第一个数组插槽”;第三个标签“2”移到第二个位置,“第二个数组插槽”,以此类推。 - loved.by.Jesus
这似乎是最好的答案,但我正在尝试重新排序一个包括对 plt.axvline() 的调用的图例。当我调用 plt.legend() 时,垂直线在图例中正确显示,但是当我调用 plt.gca().get_legend_handles_labels() 时,它的句柄没有被包含进去。 :/ - aaronsnoswell
如何确保图例的所有其他属性,例如标题,都得以保留? - user76284

102
这里有一个快速的代码片段可以对图例中的条目进行排序。它假设您已经添加了带标签的绘图元素,例如像这样的内容:
ax.plot(..., label='label1')
ax.plot(..., label='label2')

接下来是主要部分:

handles, labels = ax.get_legend_handles_labels()
# sort both labels and handles by labels
labels, handles = zip(*sorted(zip(labels, handles), key=lambda t: t[0]))
ax.legend(handles, labels)

这只是从http://matplotlib.org/users/legend_guide.html列出的代码进行简单改编。


能否在标签上使用自然排序?这里有一个起点 - Agostino
3
@Agostino: 我不确定你是否还需要这个代码,但以防万一有人需要:ax.legend(*zip(*sorted(zip(*ax.get_legend_handles_labels()), key = lambda s: [int(t) if t.isdigit() else t.lower() for t in re.split('(\d+)', s[1])])))) - Caesar
如何确保图例的所有其他属性,例如标题,都得以保留? - user76284

15
订单是确定性的,但私有部分可以随时更改,请参见代码here,它会转到here,最终到达here。子项是添加的艺术家,因此句柄列表按照它们被添加的顺序排序(这是mpl34或mpl35中行为变化)。
如果您想显式控制图例中元素的顺序,则像您在编辑中所做的那样组装处理程序和标签的列表即可。

6
链接现在指向了一个无关的行。为将来参考起见,最��固定到特定的提交。 - Josh Burkart
我认为最好的例子在[235-242]行之间。您可以简单地收集每条绘制线的句柄,然后按照自己的喜好重新排序。供以后参考,这段简单的代码可以有效地更改线条顺序:fig,ax=plt.subplots();h1,=ax.plot([1,2,3],label='tag1');h2,=ax.plot([1,2,3],label='tag2');ax.legend(handles=[h2,h1]);plt.show() - C-3PO
如何确保图例的所有其他属性,例如标题,都得以保留? - user76284

13
以下函数使得图例顺序易于控制和阅读。
您可以通过标签指定所需的顺序。它会查找图例句柄和标签,删除重复标签,并根据您给定的列表(order)进行排序或部分排序。因此,您可以像这样使用它:
reorderLegend(ax,['Top', 'Middle', 'Bottom'])

详情如下。

#  Returns tuple of handles, labels for axis ax, after reordering them to conform to the label order `order`, and if unique is True, after removing entries with duplicate labels.
def reorderLegend(ax=None,order=None,unique=False):
    if ax is None: ax=plt.gca()
    handles, labels = ax.get_legend_handles_labels()
    labels, handles = zip(*sorted(zip(labels, handles), key=lambda t: t[0])) # sort both labels and handles by labels
    if order is not None: # Sort according to a given list (not necessarily complete)
        keys=dict(zip(order,range(len(order))))
        labels, handles = zip(*sorted(zip(labels, handles), key=lambda t,keys=keys: keys.get(t[0],np.inf)))
    if unique:  labels, handles= zip(*unique_everseen(zip(labels,handles), key = labels)) # Keep only the first of each handle
    ax.legend(handles, labels)
    return(handles, labels)


def unique_everseen(seq, key=None):
    seen = set()
    seen_add = seen.add
    return [x for x,k in zip(seq,key) if not (k in seen or seen_add(k))]
 

更新后的函数在cpblUtilities.mathgraph中,位于https://gitlab.com/cpbl/cpblUtilities/blob/master/mathgraph.py

使用方法如下:

fig, ax = plt.subplots(1)
ax.add_patch(Rectangle((1,1),1,1,color='r',label='Top',alpha=.1))
ax.bar(1,2,label='Middle')
ax.add_patch(Rectangle((.8,.5),1,1,color='k',label='Bottom',alpha=.1))
legend()


reorderLegend(ax,['Top', 'Middle', 'Bottom'])
show()

可选的unique参数可以确保删除具有相同标签的重复绘图对象。

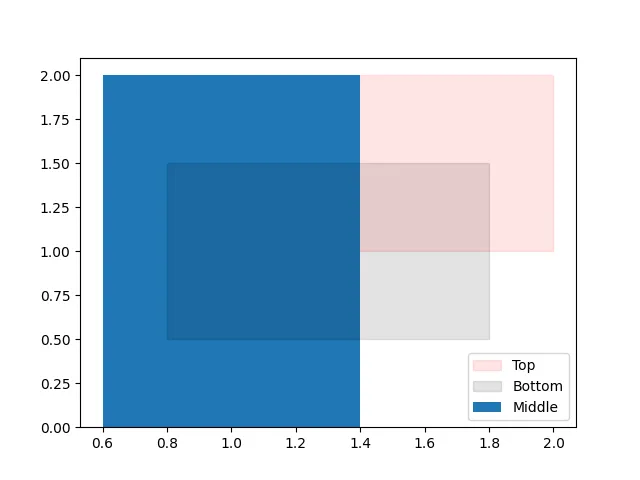
Figure after re-ordering labels


如何确保图例的所有其他属性,例如标题,都得以保留? - user76284

6

借鉴 Ian Hincks 的 答案,可以使用嵌套列表推导式在一行中更改图例元素的顺序。这样可以避免命名中间变量并减少代码重复。

plt.legend(*(
    [ x[i] for i in [2,1,0] ]
    for x in plt.gca().get_legend_handles_labels()
), handletextpad=0.75, loc='best')

我在结尾加入了一些额外的参数,以说明plt.legend()函数不需要分别调用来格式化和排序元素。


2
一个简单的按照另一个列表排序标签的方法如下: 在将所有的图和标签添加到轴上后,在显示标签之前进行以下步骤。
handles,labels = ax.get_legend_handles_labels()
sorted_legends= [x for _,x in sorted(zip(k,labels),reverse=True)] 
#sort the labels based on the list k
#reverse=True sorts it in descending order
sorted_handles=[x for _,x in sorted(zip(k,handles),reverse=True)]
#to sort the colored handles
ax.legend(sorted_handles,sorted_legends,bbox_to_anchor=(1,0.5), loc='center left')
#display the legend on the side of your plot.

例子:

from matplotlib import pyplot as plt
import numpy as np


rollno=np.arange(1,11)
marks_math=np.random.randint(30,100,10)
marks_science=np.random.randint(30,100,10)
marks_english=np.random.randint(30,100,10)
print("Roll No. of the students: ",rollno)
print("Marks in Math: ",marks_math)
print("Marks in Science: ",marks_science)
print("Marks in English: ",marks_english)
average=[np.average(marks_math),np.average(marks_science),np.average(marks_english)] #storing the average of each subject in a list

fig1=plt.figure()
ax=fig1.add_subplot(1,1,1)
ax.set_xlabel("Roll No.")
ax.set_ylabel("Marks")
ax.plot(rollno,marks_math,c="red",label="marks in math, Mean="+str(average[0]))
ax.plot(rollno,marks_science,c="green",label="marks in science, Mean="+str(average[1]))
ax.plot(rollno,marks_english,c="blue",label="marks in english, Mean="+str(average[2]))
#ax.legend() # This would display the legend with red color first, green second and the blue at last

#but we want to sort the legend based on the average marks which must order the labels based on average sorted in decending order
handles,labels=ax.get_legend_handles_labels()
sorted_legends= [x for _,x in sorted(zip(average,labels),reverse=True)] #sort the labels based on the average which is on a list
sorted_handles=[x for _,x in sorted(zip(average,handles),reverse=True)] #sort the handles based on the average which is on a list
ax.legend(sorted_handles,sorted_legends,bbox_to_anchor=(1,0.5), loc='center left') #display the handles and the labels on the side
plt.show()
plt.close()

对于一个具有以下数值的运行:

Roll No. of the students:  [ 1  2  3  4  5  6  7  8  9 10]
Marks in Math:  [66 46 44 70 37 72 93 32 81 84]
Marks in Science:  [71 99 99 40 59 80 72 98 91 81]
Marks in English:  [46 64 74 33 86 49 84 92 67 35]
The average in each subject [62.5, 79.0, 63.0]

这些标签本来会按照绘图中的顺序出现,即红色、绿色和蓝色,但是我们希望根据平均值对它们进行排序,这样就会给我们一个绿色、蓝色和红色的顺序。 查看这张图片
1

我在一个图中有几个主题相同的情节。当我尝试上面基于更改标签的答案时,我发现并排的情节会以不同的颜色显示相同的标签。

因此,对我有效的最简单的解决方案是在创建情节之前按所需的标签进行排序:

# Pandas adds the series in random order, we'll need to sort before plotting below...
pd.plotting.parallel_coordinates(
    df.sort_values(by='tier_label'), 
    ax=ax,
    class_column='tier_label', 
    alpha=0.5, color='#EDBB00 #004D98 #A50044'.split())

当然,这需要进行排序,因此您可以决定它是否适用于您的情况。此外,如果您需要标签文本与class_column不同,则可能需要添加更多代码。


网页内容由stack overflow 提供, 点击上面的
可以查看英文原文,
原文链接