Matlab:保存后翻转图例顺序和重叠的图例绘制

5
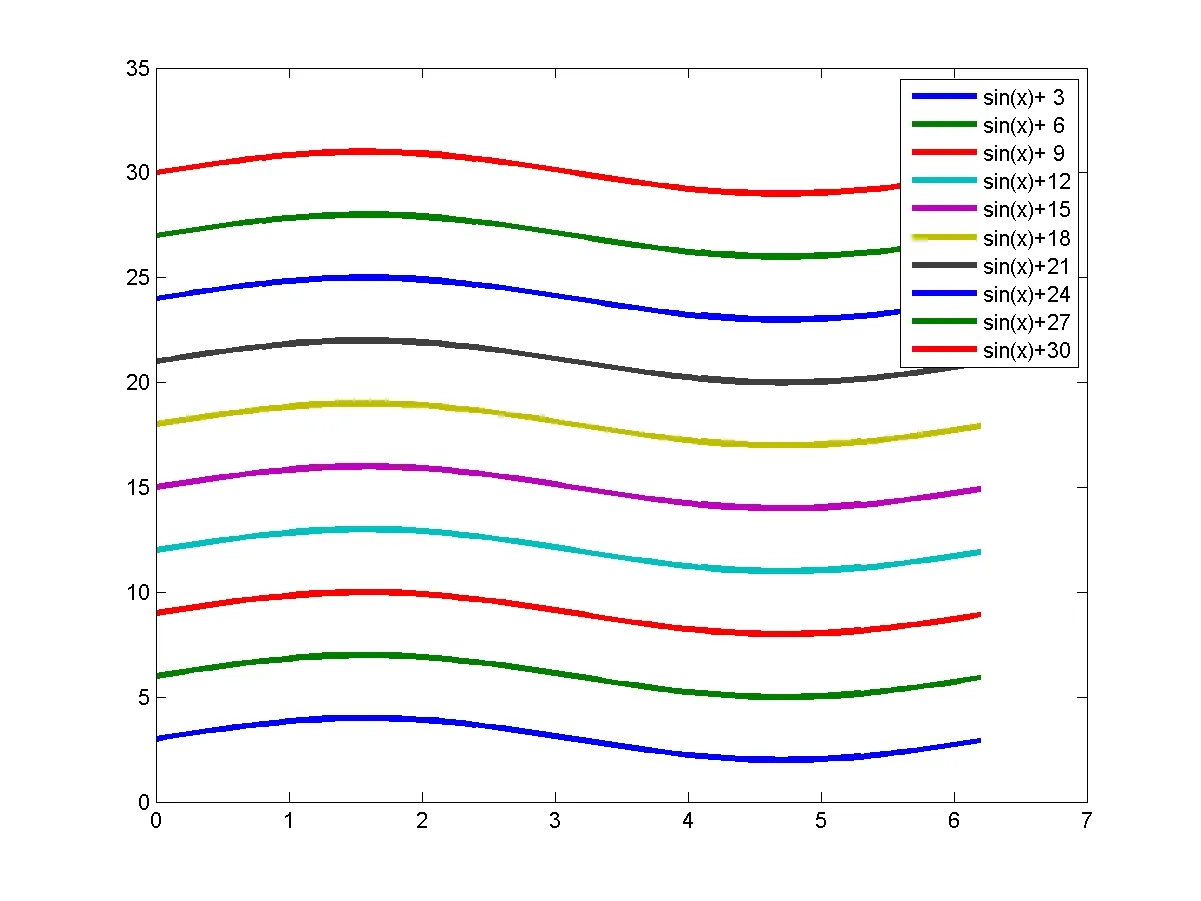
我试图根据Matlab柱状图中图例颜色的反向排序来反转我的图例条目顺序,但在我的情况下似乎不起作用。基本上我有一个GUIDE图形,它绘制了很多图,并能将它们保存为.png文件。效果如下:http://i.imgbox.com/KzEFAdia.png
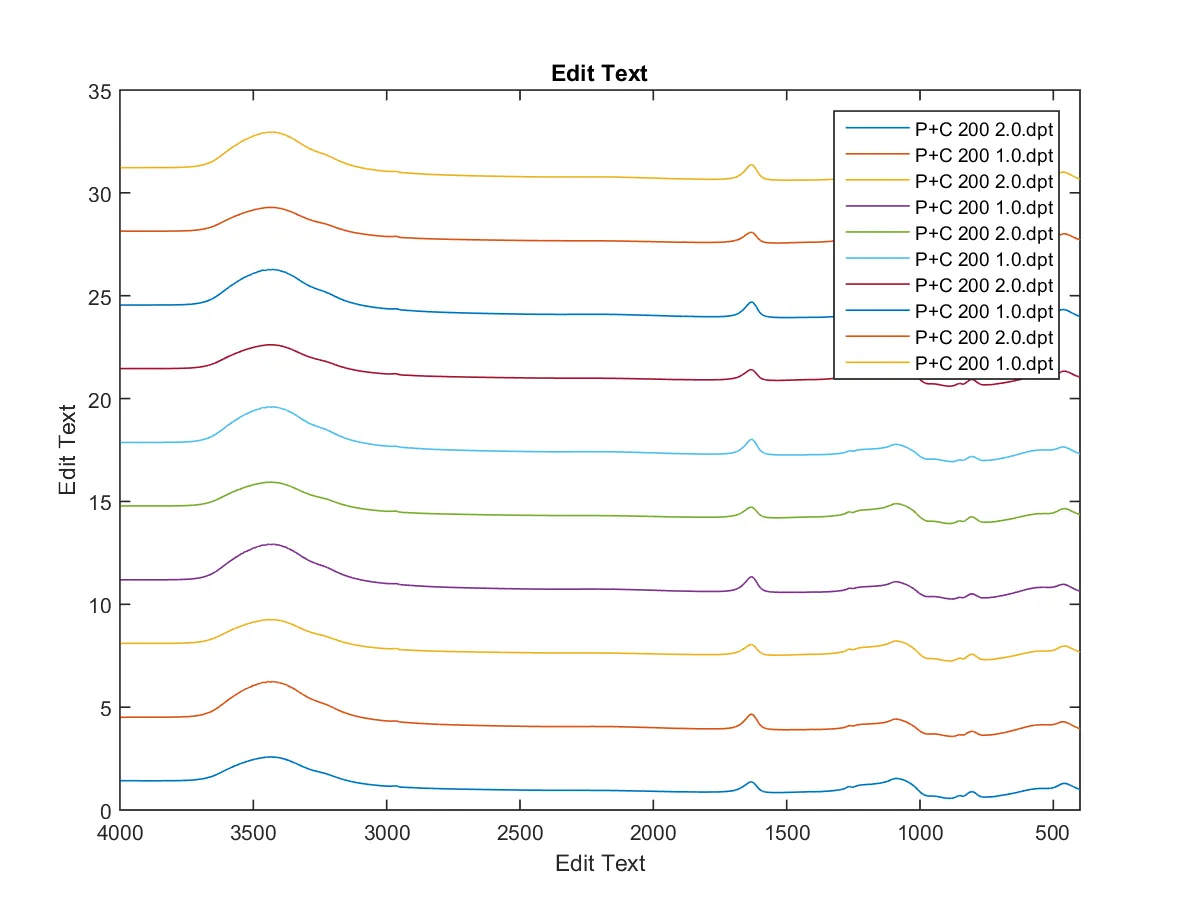
我通过翻转图例来改变文本顺序,但我无法更改图例颜色顺序。以下是我的代码:
[a b] = legend(legenda);

map = colormap; % current colormap

n = size(b,1);

z = linspace(size(map,1),1,n/3); % there is 1 text and 2 line elements for every data series, so I divide by 3

z = round(z); %otherwise matlab gets angry that indices must be real integers or logicals

MAP = map(z(:),:); % gets elements specified by linspace from colormap

到目前为止,一切都运行正常。

两个序列的 b 向量如下所示(以2.0开头,因为它是反向的):

Text    (P+C 200 2.0.dpt)
Text    (P+C 200 1.0.dpt)
Line    (P+C 200 2.0.dpt)
Line    (P+C 200 1.0.dpt)

所以根据链接的代码,我得为每一行条目更改颜色变量。

for k = (n/3 + 1):n
   a1 = get(b(k),'Children');
   set(a1,'FaceColor',MAP(ceil((k - n/3)/2), :));
end

向上取整并除以2会使索引两次相同。

然而,此代码不起作用。

我已经检查过翻转图例向量是否是问题的根源,但颜色顺序保持不变。我也尝试过使用MAP向量-没有运气。

当我在for循环中去掉a1 = ...行后面的分号时,我得到了:

a1 = 

  0x0 empty GraphicsPlaceholder array.

我该如何使其正常工作?

此外,在保存后,有没有好的方法可以使图例不覆盖图表(见上面链接的图片)?

我保存的方式是通过创建一个“可见性”为“关闭”的临时图形,并复制轴和图例,然后保存。否则它会保存整个图形。

2个回答

5
答案提供的代码在matlab条形图中颜色标注反转中不起作用的原因是因为在该情况下(bar图的绘制),图例中的对象是patches,而在您的绘图中它们是linesFaceColor只适用于patches而不适用于lines
解决问题最简单的方法应该是反转您绘制线条的顺序“从一开始”,这样可以直接使用从colormap中提取的颜色集。
然而,如果您想要在绘制图表后使用legend,除了反转legend中的项目外,还必须更改绘图中的线的颜色(如果您想使用从colormap中提取的颜色集)(在您的图片中,一些线共享相同的颜色)。
您可以通过以下两个步骤解决问题:
  • 反转图例字符串并更改绘图中的线条颜色
  • 相应地更新图例中线条的颜色

这两个步骤是必需的,因为当您更改绘图中线条的颜色时,图例中的项目会自动更新。

关于您发布的代码:您可以通过数组b访问图例字符串和线条颜色。

您可以按以下方式访问所绘制线条的句柄:

p_h=get(gca,'children')

由于您已经绘制了10条线,因此数组b构建如下:

  • b(1:10)包含指向string的句柄
  • b(11:2:30)包含指向lines的句柄
  • b(12:2:30)包含指向markers的句柄

要更改图例的位置,可以设置其location属性:如果要将其放在axes之外,则可以将其设置为以下两种情况之一:

    'NorthOutside'       outside plot box near top
    'SouthOutside'       outside bottom
    'EastOutside'        outside right
    'WestOutside'        outside left
    'NorthEastOutside'   outside top right (default for 3-D plots)
    'NorthWestOutside'   outside top left
    'SouthEastOutside'   outside bottom right
    'SouthWestOutside'   outside bottom left

在下面,您可以找到已实现上述建议的代码。
figure
% Initial plot
h_p=plot(0:.1:2*pi,bsxfun(@plus,sin([0:.1:2*pi]),[3:3:30]'),'linewidth',3)
% Initial legend
[h_leg,b]=legend(cellstr(strcat(repmat('sin(x)+',10,1),num2str([3:3:30]'))))
%
% YOUR CODE TO GENERATE NTHE NEW COLORS
%
map = colormap; % current colormap
n = size(b,1);
z = linspace(size(map,1),1,n/3); % there is 1 text and 2 line elements for every data series, so I divide by 3
z = round(z); %otherwise matlab gets angry that indices must be real integers or logicals
MAP = map(z(:),:); % gets elements specified by linspace from colormap
%
% Reverse the legend strings
%
rev_str=flipud(get(b(1:10),'string'))
%
% Get the handles of the lines in the legend
%
b1=b(11:2:30)
%
% Revere the string in the legend
% and update the color of the lne in the plot using the colors defined in
% MAP
%
p_h=get(gca,'children')
for i=1:10
   set(b(i),'string',rev_str{i})
   set(p_h(i),'color',MAP(i,:),'linewidth',3)
end
%
% Reverse the color of the lines in the legend
for i=1:10
   set(b1(i),'color',MAP(i,:),'linewidth',3)
end
%
% Move the legend outside the axes
%
set(h_leg,'location','NorthEastOutside')

原始情节

enter image description here

更新的图表

enter image description here

希望这有所帮助。

-1
从R2023b开始,图例具有一个“Direction”属性,允许您反转图例的条目顺序。对于某些图表(如面积图和堆叠条形图),还有一个额外的功能,将默认反转图例的顺序。
bar(magic(5), 'stacked');
l = legend;

legend automatically flips legend with stacked bar in R2023b.


1
你发布的代码并没有展示新属性。 - undefined
请不要重复发布相同的答案。根据问题的具体情况调整解决方案,或者如果问题是重复的,请标记为重复。重复链接:https://stackoverflow.com/a/77126478/7328782 - undefined

网页内容由stack overflow 提供, 点击上面的
可以查看英文原文,
原文链接