多行自定义图例,同一文本有两个标记符号

3

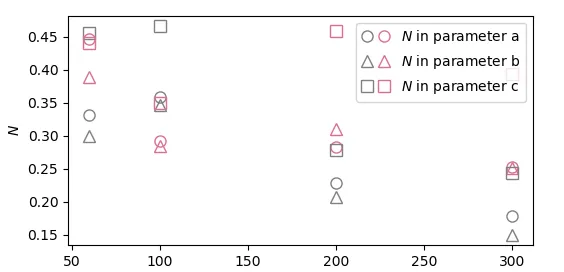
我希望能够制作出如图所示的图例类型 enter image description here

那张图我是用一些技巧来表示我真正想要的,所以它不能很好地显示图例中粉色标记的颜色。

在这张图片中,圆形表示同一参数但针对两个不同的模型;三角形和正方形标记也是如此。我想将指向同一参数的两个圆形标记放在图例的第一行,对于其他两个标记也如此排列在下面的行上。谢谢。

代码:

import matplotlib.pyplot as plt

q1 = [100.0, 60.0, 200.0, 300.0]
NO1 = [0.35799999999999998, 0.33100000000000002, 0.22900000000000001,     0.17799999999999999]
No1 = [0.34599999999999997, 0.29899999999999999, 0.20699999999999999, 0.14999999999999999]
Nb1 = [0.46600000000000003, 0.45600000000000002, 0.27800000000000002, 0.24399999999999999]

q2 = [60.0, 100.0, 200.0, 300.0]
NO2 = [0.44700000000000001, 0.29199999999999998, 0.28299999999999997, 0.253]
No2 = [0.38900000000000001, 0.28499999999999998, 0.311, 0.251]
Nb2 = [0.44, 0.34899999999999998, 0.45900000000000002, 0.39400000000000002]

fig, ax = plt.subplots(figsize = (6,3))

ax.plot(q1, NO1, marker = 'o', markerfacecolor = 'none', markeredgewidth = 1, color = 'gray', linestyle = '', markersize = 8, label = '$N$ in parameter a')
ax.plot(q2, NO2, marker = 'o', markerfacecolor = 'none', markeredgewidth = 1, color = 'palevioletred', linestyle = '', markersize = 8)#, label = '$N$ in parameter a')
ax.plot(q1, No1, marker = '^', markerfacecolor = 'none', markeredgewidth = 1, color = 'gray', linestyle = '', markersize = 8, label = '$N$ in parameter b')
ax.plot(q2, No2, marker = '^', markerfacecolor = 'none', markeredgewidth = 1, color = 'palevioletred', linestyle = '', markersize = 8)#, label = '$N$ in parameter b')  
ax.plot(q1, Nb1, marker = 's', markerfacecolor = 'none', markeredgewidth = 1, color = 'gray', linestyle = '', markersize = 8, label = '$N$ in parameter c') 
ax.plot(q2, Nb2, marker = 's', markerfacecolor = 'none', markeredgewidth = 1, color = 'palevioletred', linestyle = '', markersize = 8)#, label = '$N$ in parameter c')
#plt.legend(loc='upper right', bbox_to_anchor=(0.945, 1))
plt.xlabel('x')
plt.ylabel('$N$')
plt.xticks([60, 100, 200, 300])
plt.minorticks_on()
plt.tick_params(direction = 'in', bottom = True, top = True, left = True, right = True, which = 'major')    
plt.tick_params(direction = 'in', bottom = False, top = False, left = True, right = True, which = 'minor')  
肯定是可能的,但您能提供一个测试用例吗(即可以使用的代码)?是否只涉及两种不同的颜色? - ImportanceOfBeingErnest
@ImportanceOfBeingErnest 是的,只有两个。 - user140259
1个回答

7
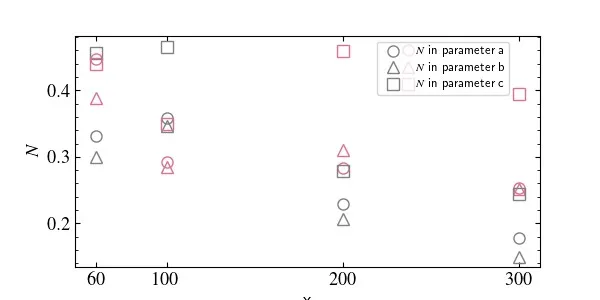
您可以使用HandlerTuple处理程序,并将每行要显示的艺术家的元组作为句柄提供给图例。
import matplotlib.pyplot as plt
import matplotlib.legend_handler

q1 = [100.0, 60.0, 200.0, 300.0]
NO1 = [0.358, 0.331, 0.229, 0.178]
No1 = [0.346, 0.299, 0.207, 0.15]
Nb1 = [0.466, 0.456, 0.278, 0.244]

q2 = [60.0, 100.0, 200.0, 300.0]
NO2 = [0.447, 0.292, 0.283, 0.253]
No2 = [0.389, 0.285, 0.311, 0.251]
Nb2 = [0.44, 0.349, 0.459, 0.394]

fig, ax = plt.subplots(figsize = (6,3))

prop = dict(markerfacecolor = 'none', markeredgewidth = 1,
            linestyle = '', markersize = 8,)
l1, = ax.plot(q1, NO1, marker = 'o', color = 'gray', label = '$N$ in parameter a', **prop)
l2, = ax.plot(q2, NO2, marker = 'o', color = 'palevioletred', **prop)
l3, = ax.plot(q1, No1, marker = '^', color = 'gray', label = '$N$ in parameter b', **prop)
l4, = ax.plot(q2, No2, marker = '^', color = 'palevioletred', **prop)
l5, = ax.plot(q1, Nb1, marker = 's', color = 'gray', label = '$N$ in parameter c', **prop) 
l6, = ax.plot(q2, Nb2, marker = 's', color = 'palevioletred', **prop)


handles = [(l1,l2), (l3,l4), (l5,l6)]
_, labels = ax.get_legend_handles_labels()

ax.legend(handles = handles, labels=labels, loc='upper right', 
          handler_map = {tuple: matplotlib.legend_handler.HandlerTuple(None)})

plt.xlabel('x')
plt.ylabel('$N$')

plt.show()

enter image description here


谢谢您的回复。昨天我认为您的代码已经能够正常工作了。您是否进行了任何更改?今天在编译时出现了以下错误:"handler_map = {tuple: matplotlib.legend_handler.HandlerTuple(None)}) TypeError: init() takes 1 positional argument but 2 were given"请问您能告诉我出错的原因是什么吗? - user140259
我没有做出任何更改(如果答案被编辑,您会看到类似于您16小时前编辑问题的方式)。您是否在两个不同版本的matplotlib或python中运行此程序?在使用HandlerTuple(ndivide=None)时,它是否有效? - ImportanceOfBeingErnest
它还报错了: "HandlerBase.init(self, **kwargs) TypeError: init()得到了一个意外的关键字参数 'ndivide'" - user140259
它给出:2.0.0 - user140259
问题确实是matplotlib的版本。非常感谢。 - user140259
显示剩余2条评论

网页内容由stack overflow 提供, 点击上面的
可以查看英文原文,
原文链接