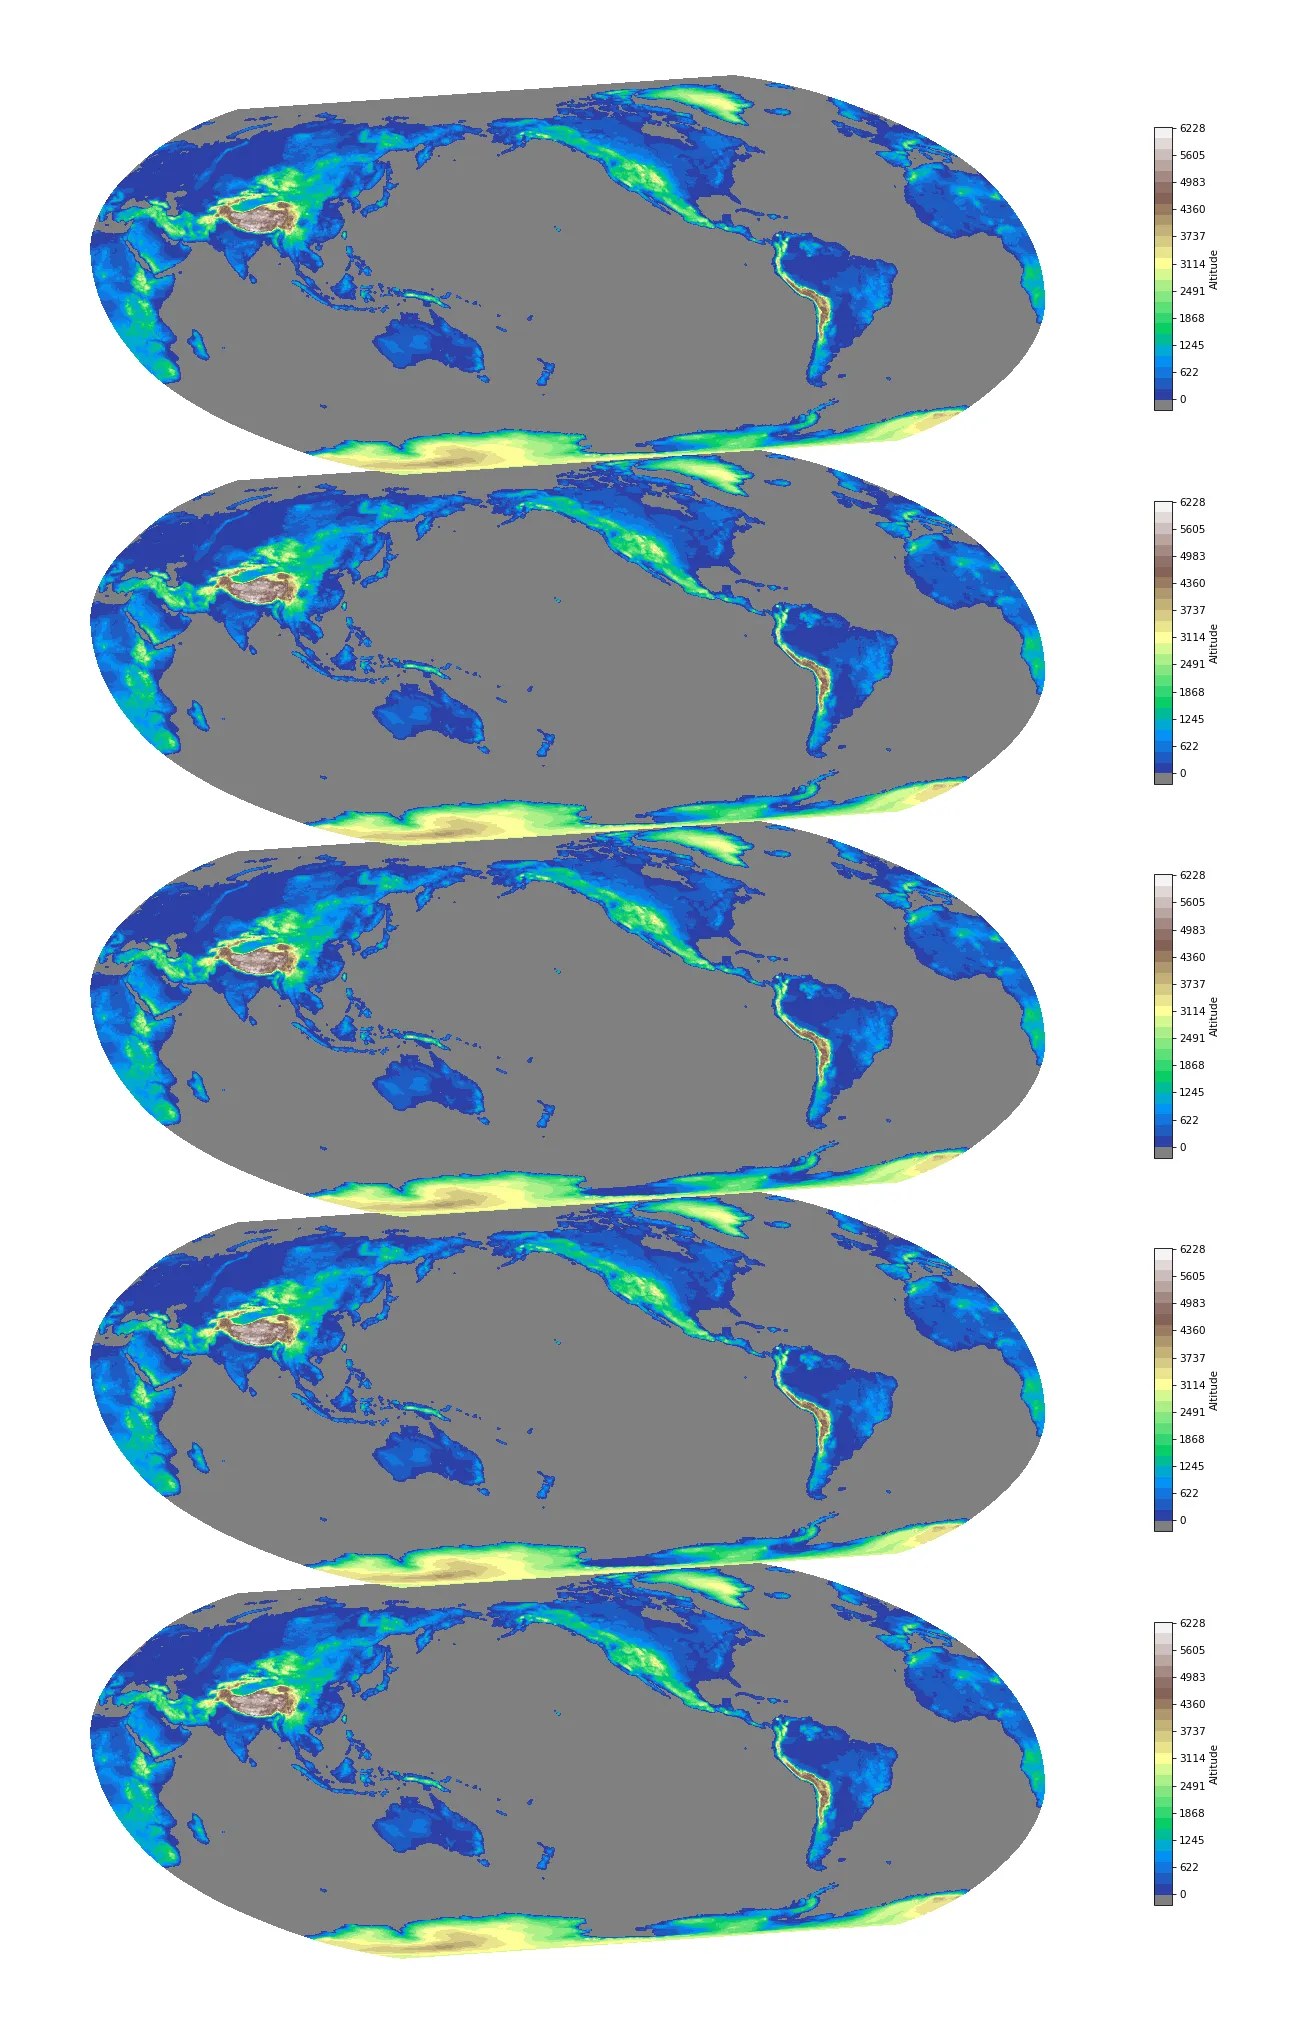
我不是Matplotlib的专家,但是我发现可以通过使用“basemap”源文件夹中包含的数据文件来获得类似的结果。可以将它们组合成一个“meshgrid”来绘制一些数据,在下面的示例中,我们绘制每个点的高度。
我使用的一个技巧是将“matplotlib”设置为正交投影,以便地图的垂直间距没有扭曲。
我将参数放在代码开头,因为您可能会发现调整很有用。
有一件事情让我感到困惑,那就是地图下面的阴影。
from mpl_toolkits.mplot3d import proj3d
from mpl_toolkits.basemap import Basemap
from mpl_toolkits.axes_grid1.inset_locator import inset_axes
import numpy as np
import matplotlib.pyplot as plt
n_maps = 5
z_spacing = 4.
z_reduction = 1E-8
view_angles = (14., -100.)
colbar_bottom = 0.2
colbar_spacing = .132
colbar_height = 0.1
def orthogonal_proj(zfront, zback):
a = (zfront+zback)/(zfront-zback)
b = -2*(zfront*zback)/(zfront-zback)
return np.array([[1,0,0,0],
[0,1,0,0],
[0,0,a,b],
[0,0,-0.0001,zback]])
proj3d.persp_transformation = orthogonal_proj
fig = plt.figure(figsize=[30, 10*n_maps])
ax = fig.gca(projection='3d')
etopo = np.loadtxt('etopo20data.gz')
lons = np.loadtxt('etopo20lons.gz')
lats = np.loadtxt('etopo20lats.gz')
m = Basemap(projection='robin', lon_0=0.5*(lons[0]+lons[-1]))
X, Y = m(*np.meshgrid(lons,lats))
Z = etopo.clip(-1)
cmap = plt.cm.get_cmap("terrain")
cmap.set_under("grey")
for i in range(n_maps):
c = ax.contourf(X, Y, z_spacing*i + z_reduction*Z, 30, cmap=cmap, vmin=z_spacing*i, extend='neither')
cax = inset_axes(ax,
width="5%",
height="100%",
loc=3,
bbox_to_anchor=(.85, colbar_spacing*i+colbar_bottom, .2, colbar_height),
bbox_transform=ax.transAxes,
borderpad=0
)
cb = fig.colorbar(c, cax=cax)
cb.set_label("Altitude")
cb.set_ticks([z_spacing * i + j/10. * z_reduction * Z.max() for j in range(11)])
cb.set_ticklabels([str(int(j/10. * Z.max())) for j in range(11)])
ax.set_axis_off()
ax.view_init(*view_angles)
ax.set_xlim3d(X.min(), X.max())
ax.set_ylim3d(Y.min(), Y.max())
ax.set_zlim3d(-1E-2, (n_maps-1)*z_spacing)
plt.savefig('world.png',dpi=75)
编辑:
如果你想要阴影效果并且不介意额外的计算时间,可以将 for 循环的开头改为以下内容:
shadow_Z = np.empty(Z.shape)
for i in range(n_maps):
    c = ax.contourf(X, Y, z_spacing*i + z_reduction*Z, 30, cmap=cmaps[i], vmin=z_spacing*i, extend='neither')
    for j in range(10):
        shadow_Z.fill(z_spacing*i - 1E-2 * j)
        s = ax.contourf((X - X.mean()) * (1 + 8E-3 * j) + X.mean() + 2E5,
                        (Y - Y.mean()) * (1 + 8E-3 * j) + Y.mean() - 2E5,
                        shadow_Z, colors='black', alpha=0.1 - j * 1E-2)
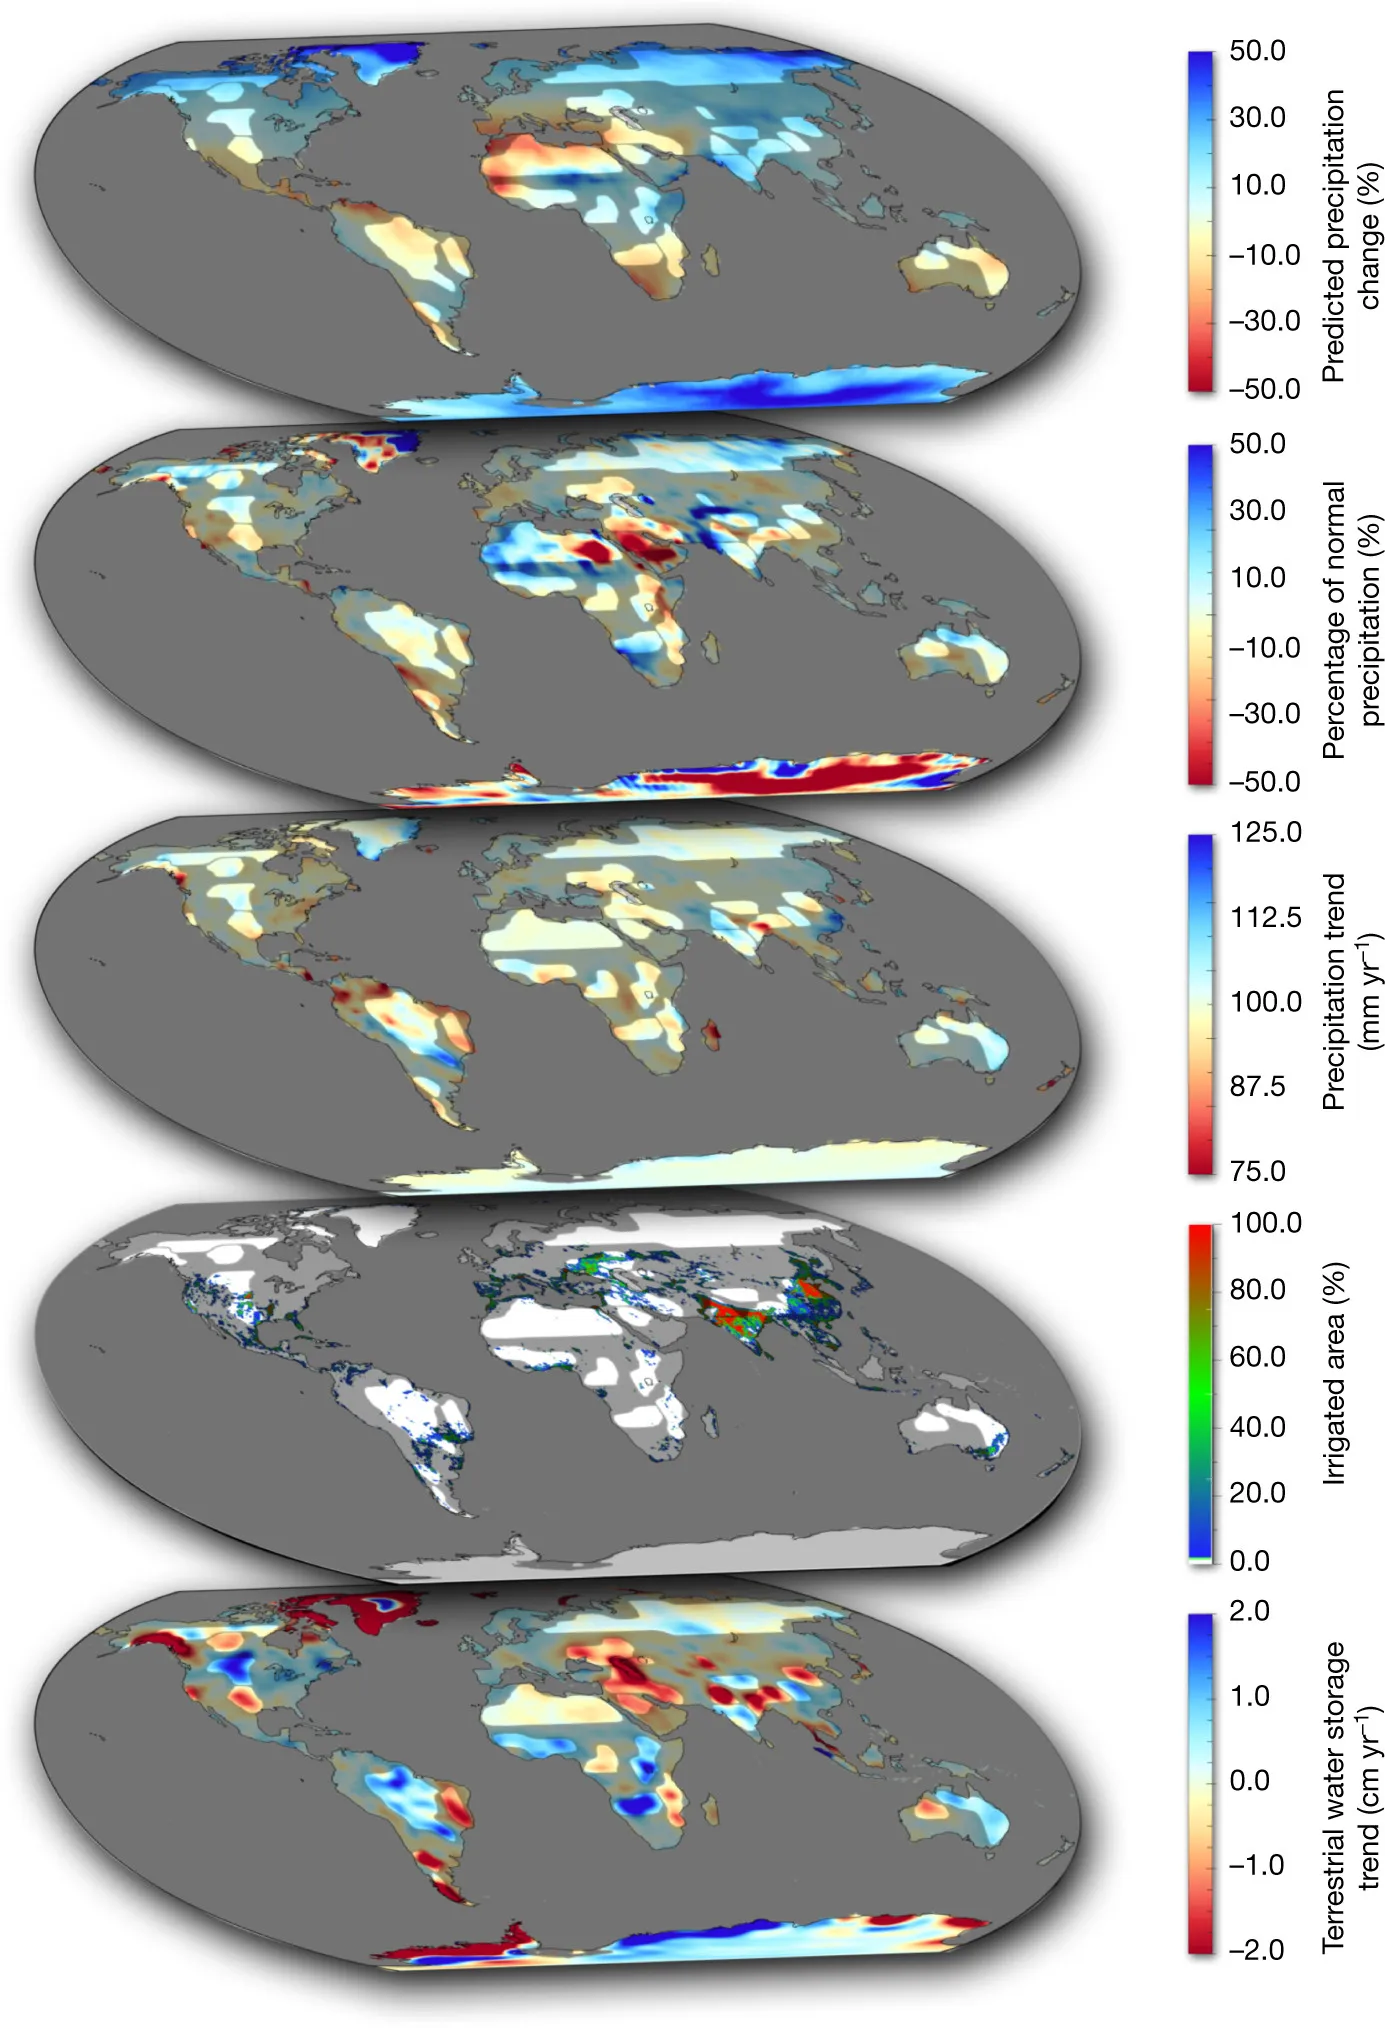
subplots。如果这不是你所需要的,请告诉我们更多关于你实际问题的信息。 - Thomas Kühn