Basemap的pcolormesh方法中的lat lon对齐 - 功能还是bug?

3
我正在使用Matplotlib和basemap在地图上绘制网格数据。我正在比较使用pcolormesh方法和散点图的区别,使用的代码如下:
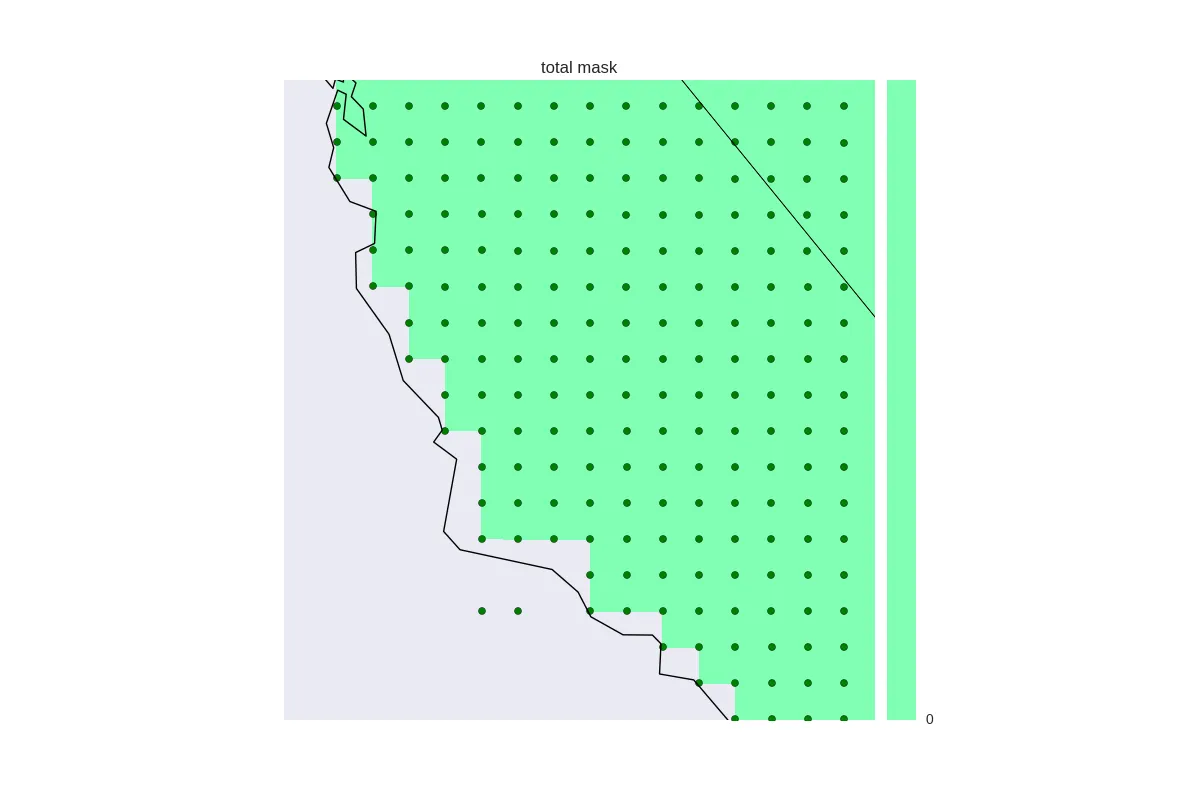
fig = plt.figure()
ax = fig.add_axes([0.1,0.1,0.8,0.8])
# setup of basemap ('lcc' = lambert conformal conic).
# use major and minor sphere radii from WGS84 ellipsoid.
m = Basemap(width=12000000,height=9000000,
            rsphere=(6378137.00,6356752.3142),\
            resolution='l',area_thresh=1000.,projection='lcc',\
            lat_1=projection['standard_parallel'][0],\
            lat_2=projection['standard_parallel'][1],\
            lat_0=projection['latitude_of_projection_origin'],\
            lon_0=projection['longitude_of_central_meridian'])
x, y = m(lons, lats) # compute map proj coordinates.
# draw coastlines and political boundaries.
m.drawcoastlines()
m.drawcountries()
m.drawstates()
# draw parallels and meridians.
# label on left and bottom of map.
parallels = np.arange(0.,80,20.)
m.drawparallels(parallels,labels=[1,0,0,1])
meridians = np.arange(10.,360.,30.)
m.drawmeridians(meridians,labels=[1,0,0,1])
#cs = m.pcolormesh(x,y,data) 
cs = m.pcolormesh(x,y,data,shading='flat',cmap=plt.cm.rainbow) 
cb = m.colorbar(cs,"right", size="5%", pad='2%', ticks=V[0::5])
m.scatter(x*data,y*data, marker='.', s=100, c='g')
ax.set_title(title)
plt.show(block=False)

我得到的情节看起来像这样:

enter image description here

注意,经纬度坐标对应于每个网格框的左下角。这是设计意图还是 bug?我认为这是设计意图,但是我看到的所有示例(http://matplotlib.org/basemap/users/examples.html)都没有提及它。我希望网格单元格以经纬度坐标点为中心,这些经纬度坐标点本身位于不规则网格上(lons、lats变量是2D数组)。如何实现这一点?
nb. 这里的数据变量只是对应于 ones 或 nans 的掩码。
谢谢。
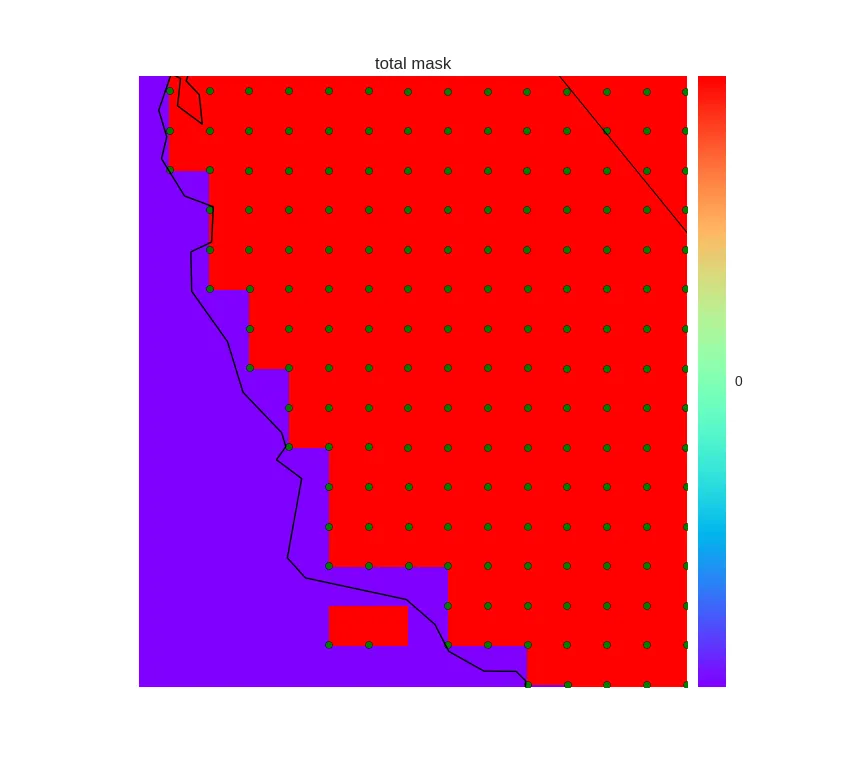
编辑:根据 Tom 的建议,如果我尝试使用 contourf,我会得到以下图像(缩放近似于第一张图像)。

enter image description here

它仍然无法很好地处理边缘,因为它不能在有限值和NaN之间绘制表面,因此存在许多缺失点。我希望每个网格单元都能被渲染。似乎imshow可以实现我的需求,但这似乎只适用于规则(线性)网格。
3个回答

1
您可以手动调整lon和lat数据,使它们向下和向左移动半个网格间距。然后在绘图时,原始的lons和lats将位于每个像素的中心。此代码还将lons和lats数组的每个维度增加1,以便它们比数据本身的维度大1,这是文档所述的理想情况。
# Subtract 1/2 the grid size from both lon and lat arrays
lons = lons - dlon/2
lats = lats - dlat/2
# Add 1 grid spacing to the right column of lon array and concatenate it as an additional column to the right
lons = np.c_[ lons, lons[:,-1]+dlon ]
# Duplicate the bottom row of the lon array and concatenate it to the bottom
lons = np.r_[ lons, [lons[-1,:]] ]
# Duplicate the right-most column of lats array and concatenate it on the right
lats = np.c_[ lats, lats[:,-1] ]
# Add 1 grid spacing to the bottom row of lat array and concatenate it as an additional row below
lats = np.r_[ lats, [lats[-1,:]+dlat] ]

# Then plot as before
m.pcolormesh(lons, lats, data)

1

pcolormesh 函数将节点坐标作为 XY 参数。从 docs(针对 pcolor,但对于 pcolormesh 也是相同的):

X and Y, if given, specify the (x, y) coordinates of the colored quadrilaterals; the quadrilateral for C[i,j] has corners at:

(X[i,   j],   Y[i,   j]), 
(X[i,   j+1], Y[i,   j+1]), 
(X[i+1, j],   Y[i+1, j]), 
(X[i+1, j+1], Y[i+1, j+1]).

Ideally the dimensions of X and Y should be one greater than those of C; if the dimensions are the same, then the last row and column of C will be ignored.

我建议对于你的 xy 中每个四边形点的坐标取平均值,然后使用这些坐标来进行 scatter,以使你的点居中。

1
谢谢,这确实澄清了一些问题。然而,我的散点已经在正确的位置上了。我想要调整的是pcolormesh,使得每个网格单元与散点居中对齐。此外,考虑到我的纬度和经度网格是不规则的,我不确定如何手动计算每个四边形的重心。 - piyushnz
contourf使用单元格中心点。对你来说,这样的方式是否可行,而不是使用pcolormesh? - tmdavison

0
要计算2D中心网格点数组的左下角,可以使用以下平均例程:
# adjust xlon,xlat values so they represent corners of grid cells for mapping using pcolor
# calculate average between two points and reassign lat/lon pairs
# skip first row and column of data since there are no points outside of domain to average with

# define empty arrays for storing new lats, lons, and values
corner_lats=np.empty([len(xlat[:,0])-1, len(xlat[0,:])-1],float)
corner_lons=np.empty([len(xlat[:,0])-1, len(xlat[0,:])-1],float)
corner_values=np.zeros([len(xlat[:,0])-1, len(xlat[0,:])-1],float)

# go through each xlat and xlon array and calculate LL corners
for lat in range(1,len(xlat[:,0])-1):
    for lon in range(1,len(xlat[0,:])-1):
        corner_lats[lat,lon]=(xlat[lat,lon]+xlat[lat+1,lon])/2
        corner_lons[lat,lon]=(xlon[lat,lon]+xlon[lat,lon+1])/2
        corner_values[lat-1,lon-1]=data[lat,lon]

然后在映射时,使用新的角落纬度、经度和数值:
m.pcolor(corner_lons,corner_lats,corner_values,latlon=True)

网页内容由stack overflow 提供, 点击上面的
可以查看英文原文,
原文链接