这是我的代码,我想把图表做得更大,以便更容易阅读。我试图基于不纯度均值减少获取特征重要性。我得到了一些输出,但由于我的条形图有63个条柱,所以我希望它更大。我尝试了所有已注释的东西。请问有人能建议如何让这个条形图更易读吗?
import pandas as pd
from matplotlib.pyplot import figure
# fig.set_figheight(20)
# fig.set_figwidth(20)
#plt_1 = plt.figure(figsize=(20, 15), dpi = 100)
forest_importances = pd.Series(importances, index=feature_names)
fig, ax = plt.subplots()
forest_importances.plot.bar(yerr=std, ax=ax)
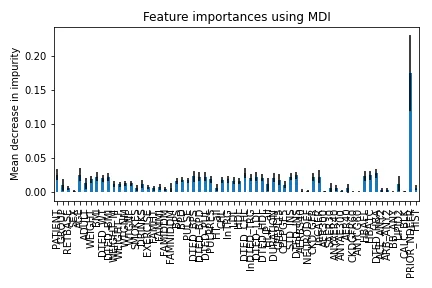
ax.set_title("Feature importances using MDI")
ax.set_ylabel("Mean decrease in impurity")
# fig = plt.figure()
fig.tight_layout()
plt.show()