我有几个不同的条形图需要生成,其中包含不同数量的条。因此图的总宽度和高度也会变化,但是我希望所有的条形图中的条都保持相同的大小。
目前为止我尝试的方法是根据条数成比例地调整figsize大小,但是这种方法似乎不太一致。
以下是示例代码:
nb_bars_list = [2, 10]

for i, nb_bars in enumerate(nb_bars_list):
    # Resize proportionally to the number of bars
    figsize = [1+nb_bars, 5]
    # Prepare the ticks
    ticks = np.arange(1, 1+nb_bars, 1)
    # Generate random points
    points = [np.random.randn(10) for x in xrange(nb_bars)]
    # Make the plot
    fig, ax = plt.subplots()
    if figsize:
        fig.set_size_inches(figsize[0], figsize[1], forward=True)
    for b in xrange(nb_bars):
        ax.bar(ticks[b], points[b].mean())
    fig.savefig('test%i' % i, bbox_inches='tight')
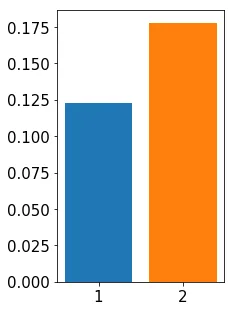
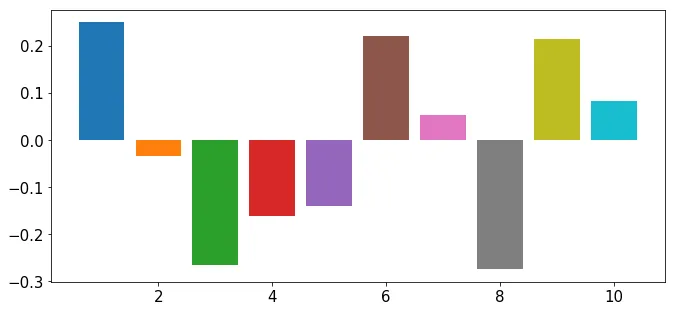
这将导致如下结果:
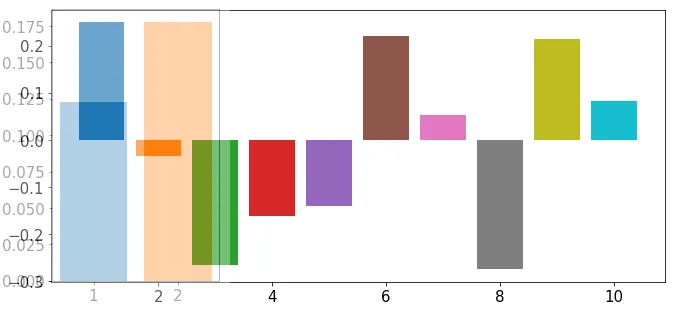
 如果我们使用GIMP重叠这两个图像,我们可以清楚地看到条形宽度的差异:
 我该如何确保无论有多少条,都具有相同的条形宽度?
我正在使用matplotlib 2。

plt.tight_layout()或在fig.subplot_adjust()之前使用它,否则它将无效! - gaboroustight_layout,它将仅计算自己最适合的子图参数并覆盖之前设置的任何内容。 - ImportanceOfBeingErnest