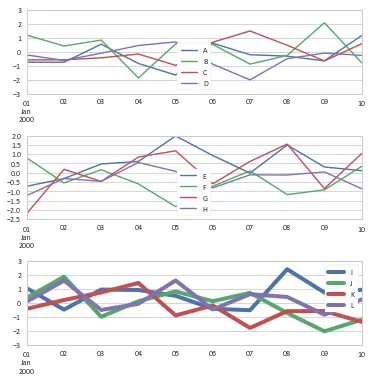
我正在使用pandas在单个图中绘制3个子图。以下代码可以实现此操作。然而,我遇到了使子图中的数据线变粗的问题。有人知道如何做吗?
## setup 3 dataframes
t_index=pd.date_range('1/1/2000', periods=10);
df_1 = DataFrame(np.random.randn(10, 4), index=t_index, columns=['A', 'B', 'C', 'D']);
df_2 = DataFrame(np.random.randn(10, 4), index=t_index, columns=['E', 'F', 'G', 'H']);
df_3 = DataFrame(np.random.randn(10, 4), index=t_index, columns=['I', 'J', 'K', 'L']);

##Setup Figure and add subplots
fig, axes = plt.subplots(3, 1, figsize=(6, 6))
plt.subplots_adjust(wspace=0.5, hspace=0.5);
target1 = axes[0]
target2 = axes[1]
target3 = axes[2]

df_1.plot(ax=target1)
df_2.plot(ax=target2)
df_3.plot(ax=target3)
linewidth=2.0。http://matplotlib.org/users/pyplot_tutorial.html - tglaria