我正在绘制多个热力图。代码如下:
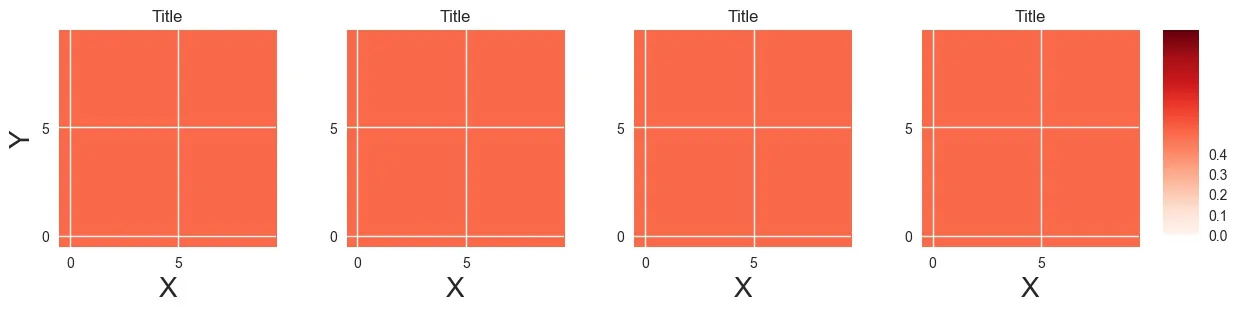
图形如下:
那么怎样才能去掉白线,同时又保持该图形的外观和当前外观相似呢?
谢谢大家帮助!
import seaborn as sns
import numpy as np
import matplotlib.pyplot as plt
FONTSIZE=20
fig, axes = plt.subplots(nrows=1, ncols=4,figsize=(12,3))
k=0
for ax in axes.flat:
    mat = np.zeros((10,10)) + 0.5
    im = ax.imshow(mat,interpolation='nearest', vmin=0.0, vmax=1.0,cmap='Reds')
    ax.set_xlim([-0.5, 9.0 + 0.5])
    ax.set_ylim([-0.5, 9.0 + 0.5])
    ax.set_xticks([0,5])
    ax.set_yticks([0,5])
    ax.set_xlabel('X',fontsize=FONTSIZE)
    if k == 0:
        ax.set_ylabel('Y',fontsize=FONTSIZE)
    ax.set_title('Title')
    k += 1
# Make an axis for the colorbar on the right side
cax = fig.add_axes([0.99, 0.235, 0.03, 0.682])
cbar = fig.colorbar(im, cax=cax,ticks=[0.0,0.1,0.2,0.3,0.4])
cbar.ax.set_yticklabels(['0.0','0.1','0.2','0.3','0.4'])
figtype = 'jpg'
fig.tight_layout()
fig.savefig('aaa.' + copy(figtype),format = figtype,bbox_inches='tight')
图形如下:
import seaborn as sns,那么这些白线就会消失。但在这种情况下,该图形看起来会很丑。那么怎样才能去掉白线,同时又保持该图形的外观和当前外观相似呢?
谢谢大家帮助!