ggplot的图形对象如何与tableGrob对齐

6

我很难找到将ggplot grob和table grob对齐的解决方案。我尝试按照这里的指示进行操作,但仍未得到所需的结果。

library(grid)
library(gridExtra)
library(ggplot2)
library(tibble)
library(gtable)
dat <- tibble::rownames_to_column(mtcars, "car") #convert rownames to first col

plot1 <- ggplot(dat, aes(car, mpg)) +
    geom_bar(stat = "identity") +
    coord_flip()

g1 <- ggplotGrob(plot1)
tb1 <- tableGrob(dat$cyl)
g1 <- gtable_add_cols(g1, unit(0.2, "npc"))
g1 <- gtable_add_grob(g1, grobs = tb1, t=3, l=ncol(g1), b=6, r=ncol(g1))

grid.newpage()
grid.draw(g1)

我希望每个表格单元格都与直方图中的相关条形对齐,但仍然无法理解如何从布局中实现t、l、b和r。 这是我得到的输出enter image description here
2个回答

8

我在使用ggplot2制作类似森林图的东西时,遇到了与上述相似的问题,但没有找到其他解决方案能够满足我的需求。上面的回答对我不起作用——表格没有显示出来。所以我想到了一个代码不太漂亮的解决方案,但实际上我很喜欢这种清晰的视觉输出。

我喜欢这个解决方案的几个方面:

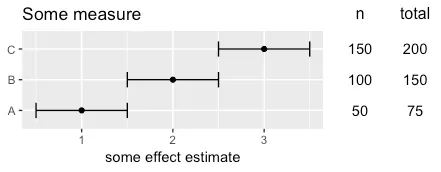
  • 我将一组自定义文本对齐在右侧的图形中,而不是放在表格中,其中每个文本条目和每个标签在图形中都有匹配的对齐方式。
  • 我使用居中的 ggtitle 来对齐每组文本的“列标题”。这些可以是任何类型的字符串(在我实际使用中,我有点估计和置信区间)。
library(gridExtra)
library(ggplot2)

dat <- data.frame(
    label = c("A", "B", "C"),
    point_est = c(1,2,3),
    lb_ci = c(.5, 1.5, 2.5),
    ub_ci = c(1.5, 2.5, 3.5),
    n = c(50, 100, 150),
    total = c(75, 150, 200)
)

plot1 <- ggplot(dat, aes(x=point_est, y=label)) +
    geom_point() +
    geom_errorbarh(aes(xmin=lb_ci, xmax=ub_ci), height=.5) +
    ggtitle("Some measure") +
    ylab(NULL) + xlab("some effect estimate")

tab_base <- ggplot(dat, aes(y=label)) +
    ylab(NULL) + xlab("  ") + 
    theme(plot.title = element_text(hjust = 0.5, size=12), ## centering title on text
        axis.text.x=element_text(color="white"), ## need text to be printed so it stays aligned with figure but white so it's invisible
        axis.line=element_blank(),
        axis.text.y=element_blank(),axis.ticks=element_blank(),
        axis.title.y=element_blank(),legend.position="none",
        panel.background=element_blank(),panel.border=element_blank(),panel.grid.major=element_blank(),
        panel.grid.minor=element_blank(),plot.background=element_blank())

tab1 <- tab_base + 
    geom_text(aes(x=1, label=n)) + 
    ggtitle("n")

tab2 <- tab_base +
    geom_text(aes(x=1, label=total)) + 
    ggtitle("total")

lay <-  matrix(c(1,1,1,1,1,1,2,3), nrow=1)
grid.arrange(plot1, tab1, tab2, layout_matrix = lay)

enter image description here


1
感谢提供另一种解决方案! - yuskam
1
只是想感谢@Nicholas G Reich发布这个解决方案。我花了几个小时寻找一张与图表完美对齐的表格的解决方案。非常感激! - Keelin

3

默认情况下,单元格高度具有绝对大小以适应文本,但是您可以将它们更改为相对单位,以便随着绘图面板缩放。

library(grid)
library(gridExtra)
library(ggplot2)
library(tibble)
library(gtable)
dat <- tibble::rownames_to_column(mtcars, "car") #convert rownames to first col

plot1 <- ggplot(dat, aes(car, mpg)) +
  geom_bar(stat = "identity") +
  coord_flip()

g1 <- ggplotGrob(plot1)
tb1 <- tableGrob(dat$cyl, theme = ttheme_default(10))
tb1$heights = unit(rep(1/(nrow(tb1)), nrow(tb1)), "npc")
tb1$widths = unit.pmax(tb1$widths, unit(2, "lines"))
g1 <- gtable_add_cols(g1, sum(tb1$widths))
g1 <- gtable_add_grob(g1, grobs = tb1, t=6, l=ncol(g1), b=6, r=ncol(g1))

grid.newpage()
grid.draw(g1)

enter image description here


感谢您的指导,但我仍然不明白为什么t=6和b=6。当我使用gtable_show_layout(g1)查看布局时,该单元格为(3,6)。 - yuskam
我现在看到你没有使用我正在使用的相同的plot1图,这会导致不同的布局。再次感谢您的解释。 - yuskam
你介意分享一下带有顶部 x 轴标题的 plot1 代码吗?我很难复制底部刻度和轴标题的解决方案。 - yuskam
3
当我运行这段代码时,绘图的右侧出现了一片空白,与上面显示的图形不同。也许某个软件包的更新已经导致这不再起作用了? - Nicholas G Reich

网页内容由stack overflow 提供, 点击上面的
可以查看英文原文,
原文链接