我在对齐网格图形对象时遇到了一些问题 -- 我已经阅读了所有可以找到的文档,包括Murrell的书,但没有成功。我认为我正在尝试做的事情非常简单,所以希望我只是错过了一些简单的东西。
这里有一个可重现的示例,可以在Hadley的hflights包中按目的地生成所有航空公司的PDF(与我在不同数据集上尝试的内容相同)。
require(hflights)
require(gridExtra)
require(Cairo)

make_table <- function(df) {
  p <- tableGrob(
    df
   ,padding.h=unit(.25, "mm")
   ,show.rownames=FALSE
   ,gpar.coretext = gpar(fontsize=8, lineheight=0)
   #this doesn't seem to justify the table
   ,just = c("bottom")
   ,show.box = T
  )
  return(p)
}

dests <- unique(hflights$Dest)

#list to hold the plots
plot_list <- list()

#loop over destinations and make a simple report
for (i in dests) {
  #just this destination
  this_dest <- hflights[hflights$Dest == i, ]

  #the title
  title <- textGrob(label = i, gp = gpar(fontsize=72, fontface = 'bold'))

  #a table of carriers
  carriers <- unique(this_dest$UniqueCarrier)
  carriers <- data.frame(
    carrier=carriers
  )
  carrier_table <- make_table(carriers)

  #put them together
  p <- arrangeGrob(
    title, carrier_table
   ,nrow=2
  )

  plot_list[[i]] <- p
}


#print the report
Cairo(
  width = 11, height = 8.5
 ,file = paste('destinations.pdf', sep = ''), type="pdf"
 ,units = "in"
)

  print(plot_list)

dev.off()
我希望
make_table 函数中由 tableGrob 生成的整个表格能够顶部对齐,现在它在 grob 中垂直和水平居中。我需要在调用 tableGrob 时进行设置,还是在调用 arrangeGrob 时进行设置? 换句话说,如果上述内容不清楚,我要如何使整个表格(而非其中文本)相对于其容器顶部/底部/左侧/右侧对齐?谢谢!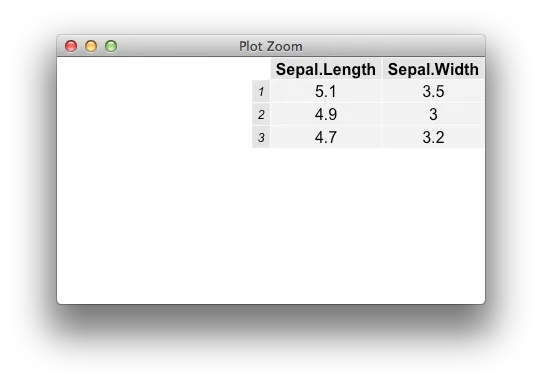
grid包本身。特别是grid.layout函数非常有用,可以创建自定义大小的视口。你的代码问题源于arrangeGrob将纸张分成两个大小相等的视口。一旦你习惯了在grid中设置视口布局,你就永远不会想错过它。 - SimonG