我最近开始使用tableGrob和gridextra来合并多个图表和表格。我想让我的tableGrob有一个脚注和标题。
以下链接很好地回答了这个问题:Adding text to a grid.table plot 但是在上面的代码中,如果脚注太长,它会被截断。请问有人能否提供一种替代方法,使得脚注在到达表格末尾时自动换行?如果可以在单词中间换行,那也可以。
以下链接很好地回答了这个问题:Adding text to a grid.table plot 但是在上面的代码中,如果脚注太长,它会被截断。请问有人能否提供一种替代方法,使得脚注在到达表格末尾时自动换行?如果可以在单词中间换行,那也可以。
test <- data.frame(boo = c(20,1), do = c(2,10), no = c(3,5),co = c('ed','jeff'))
t1 <- tableGrob(test)
tw <- convertWidth(unit(grobWidth(t1),'npc'),
"in", valueOnly = T)
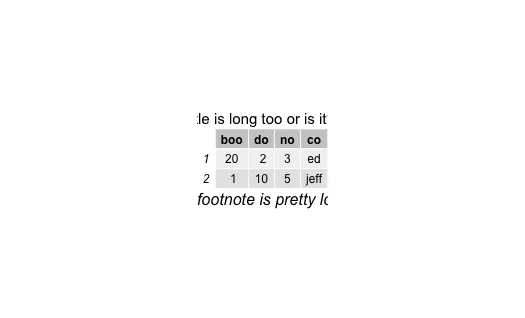
title <- textGrob("Title is long too or is it??",gp=gpar(fontsize=15))
footnote <- textGrob("footnote is pretty longgg but not unusually longgggggggggkjwd jwkldn", x=0, hjust=0,
gp=gpar( fontface="italic"))
padding <- unit(0.5,"line")
t1 <- gtable_add_rows(t1,
heights = grobHeight(title) + padding,
pos = 0)
t1 <- gtable_add_rows(t1,
heights = grobHeight(footnote)+ padding)
t1 <- gtable_add_grob(t1, list(title, footnote),
t=c(1, nrow(t1)), l=c(1,1),
r=ncol(t1))
grid.arrange(t1)
当我将绘图和表格组合在一起时,我希望这个功能也能正常工作。请帮忙。
我尝试使用strwrap并将宽度设置为grobWidth,但是对我没有用。