如何使用OpenCV绘制三维坐标轴以进行面部姿态估计?
6
- tidy
9
为什么不直接从你的链接中获取代码呢? - berak
3创建3D轴作为顶点/向量。将旋转应用于它们。将它们投影到您的相机/图像平面上。 - Micka
4不要读有关相机模型、计算机图形学、渲染流水线、相机投影的内容。如果想走捷径,可以使用OpenGL。如果不想,就要学习和理解它是如何实现的(对于只投射简单线条来说并不太难)。OpenCV有一些函数可以帮助你建立相机模型并转换顶点,但你需要理解自己想做什么以及如何实现它。-http://en.wikipedia.org/wiki/3D_projection - Micka
1按照 @Micka 的建议去做。如果你不想使用OpenGL,那么你想用什么?你想使用OpenCV吗? - bendervader
是的,我想使用OpenCV来绘制结果。 - tidy
显示剩余4条评论
5个回答
9
只要您拥有相机参数,就可以在纯OpenCV中完成此操作。您应该能够创建三个向量,分别对应于x轴、y轴和z轴(基本上是点[0,0,0] [1,0,0],[0,1,0],[0,0,1],稍后将它们投影到图像平面上。您应该首先根据偏航/俯仰/翻滚旋转这些点(例如通过乘以旋转矩阵)。
为了将3D点投影到图像平面,请使用projectPoints函数。它使用3D点、相机参数并生成2D图像点。一旦您获得了图像点,您只需使用line函数在投影的中心点(3D中的[0,0,0])和每个轴点的投影之间绘制线条即可。
- Andrzej Pronobis
6
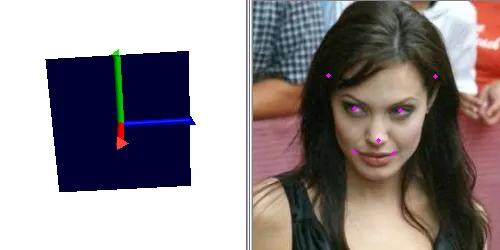
一个简单的例子:
def draw_axis(img, R, t, K):
    # unit is mm
    rotV, _ = cv2.Rodrigues(R)
    points = np.float32([[100, 0, 0], [0, 100, 0], [0, 0, 100], [0, 0, 0]]).reshape(-1, 3)
    axisPoints, _ = cv2.projectPoints(points, rotV, t, K, (0, 0, 0, 0))
    img = cv2.line(img, tuple(axisPoints[3].ravel()), tuple(axisPoints[0].ravel()), (255,0,0), 3)
    img = cv2.line(img, tuple(axisPoints[3].ravel()), tuple(axisPoints[1].ravel()), (0,255,0), 3)
    img = cv2.line(img, tuple(axisPoints[3].ravel()), tuple(axisPoints[2].ravel()), (0,0,255), 3)
    return img
![![]](https://istack.dev59.com/x4D6l.webp)
- user5196333
3
6请问您的例子中的R、t和K是什么意思? - juerg
1@juerg 在第30页的http://www.cs.cmu.edu/~16385/s17/Slides/11.1_Camera_matrix.pdf上。它们是相机矩阵的分解。 - Gulzar
1R 可以是任意的三维旋转矩阵。 - Gulzar
3
我使用了这段代码,它来自于巴塞尔人脸模型(BFM),你可以在他们的网站上找到Matlab代码。
def draw_axis(img, yaw, pitch, roll, tdx=None, tdy=None, size = 100):

    pitch = pitch * np.pi / 180
    yaw = -(yaw * np.pi / 180)
    roll = roll * np.pi / 180

    if tdx != None and tdy != None:
        tdx = tdx
        tdy = tdy
    else:
        height, width = img.shape[:2]
        tdx = width / 2
        tdy = height / 2

    # X-Axis pointing to right. drawn in red
    x1 = size * (math.cos(yaw) * math.cos(roll)) + tdx
    y1 = size * (math.cos(pitch) * math.sin(roll) + math.cos(roll) * math.sin(pitch) * math.sin(yaw)) + tdy

    # Y-Axis | drawn in green
    #        v
    x2 = size * (-math.cos(yaw) * math.sin(roll)) + tdx
    y2 = size * (math.cos(pitch) * math.cos(roll) - math.sin(pitch) * math.sin(yaw) * math.sin(roll)) + tdy

    # Z-Axis (out of the screen) drawn in blue
    x3 = size * (math.sin(yaw)) + tdx
    y3 = size * (-math.cos(yaw) * math.sin(pitch)) + tdy

    cv2.line(img, (int(tdx), int(tdy)), (int(x1),int(y1)),(0,0,255),3)
    cv2.line(img, (int(tdx), int(tdy)), (int(x2),int(y2)),(0,255,0),3)
    cv2.line(img, (int(tdx), int(tdy)), (int(x3),int(y3)),(255,0,0),3)

    return img
- Hong-jik Kim
1
也可以使用OpenCV函数drawFrameAxes来实现此功能。
scale = 0.1
img = cv2.drawFrameAxes(img, K, distortion, rotation_vec, translation_vec, scale)
- HiRod
1
上面给出的代码有些需要澄清的地方
def draw_axis(img, rotation_vec, t, K, scale=0.1, dist=None):
    """
    Draw a 6dof axis (XYZ -> RGB) in the given rotation and translation
    :param img - rgb numpy array
    :rotation_vec - euler rotations, numpy array of length 3,
                    use cv2.Rodrigues(R)[0] to convert from rotation matrix
    :t - 3d translation vector, in meters (dtype must be float)
    :K - intrinsic calibration matrix , 3x3
    :scale - factor to control the axis lengths
    :dist - optional distortion coefficients, numpy array of length 4. If None distortion is ignored.
    """
    img = img.astype(np.float32)
    dist = np.zeros(4, dtype=float) if dist is None else dist
    points = scale * np.float32([[1, 0, 0], [0, 1, 0], [0, 0, 1], [0, 0, 0]]).reshape(-1, 3)
    axis_points, _ = cv2.projectPoints(points, rotation_vec, t, K, dist)
    img = cv2.line(img, tuple(axis_points[3].ravel()), tuple(axis_points[0].ravel()), (255, 0, 0), 3)
    img = cv2.line(img, tuple(axis_points[3].ravel()), tuple(axis_points[1].ravel()), (0, 255, 0), 3)
    img = cv2.line(img, tuple(axis_points[3].ravel()), tuple(axis_points[2].ravel()), (0, 0, 255), 3)
    return img
- Avivos
网页内容由stack overflow 提供, 点击上面的可以查看英文原文,
原文链接
原文链接