如何在R中添加透视图的色条

4

也许这很简单,但是我搜索了几个小时,仍然找不到如何在R中的persp图旁边添加colorbar。有人可以帮忙吗?谢谢。

persp(w_lb, w_dti, cm[[i]], 
        theta = -30, phi = 30, expand = 0.95, 
        col=color[facetcol], shade = 0.25, 
        ticktype = "detailed", border = NA, 
        xlab = "LB", ylab = "DT", zlab="CM", 
        zlim=c(0.0, 1.0)
)

你需要使用 persp 吗?在 library(lattice) 中的 wireframe 函数有一个 colorkey 参数。 - Rich Scriven
不幸的是,在这种情况下我需要使用persp。 - Joarder Kamal
2个回答

6

fields包中,可以使用image.plot添加图例。以下是从?persp中的示例:

library(fields)

## persp example code
par(bg = "white")
x <- seq(-1.95, 1.95, length = 30)
y <- seq(-1.95, 1.95, length = 35)
z <- outer(x, y, function(a, b) a*b^2)
nrz <- nrow(z)
ncz <- ncol(z)
# Create a function interpolating colors in the range of specified colors
jet.colors <- colorRampPalette( c("blue", "green") )
# Generate the desired number of colors from this palette
nbcol <- 100
color <- jet.colors(nbcol)
# Compute the z-value at the facet centres
zfacet <- (z[-1, -1] + z[-1, -ncz] + z[-nrz, -1] + z[-nrz, -ncz])/4
# Recode facet z-values into color indices
facetcol <- cut(zfacet, nbcol)
persp(x, y, z, col = color[facetcol], phi = 30, theta = -30, axes=T, ticktype='detailed')

## add color bar
image.plot(legend.only=T, zlim=range(zfacet), col=color)

感谢@Marc_in_the_box的提示:颜色条的范围由zfacet定义,而不是z带有颜色条的透视图


谢谢你的好回答。它完美地运行了 :) 再次感谢。 - Joarder Kamal

4

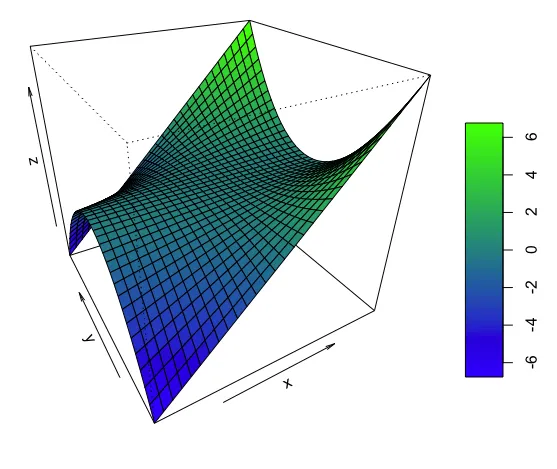
persp 有一种基于面片中点计算颜色的棘手方式。这使得在提取颜色级别方面您的工作有些困难,但我认为我已经找到了一种方法。无论如何,layout 可能是拆分设备并添加彩色条的最佳选择:

示例:

layout(matrix(1:2, nrow=1, ncol=2), widths=c(4,1), heights=1)
par(bg = "white", mar=c(4,4,1,1))
x <- seq(-1.95, 1.95, length = 30)
y <- seq(-1.95, 1.95, length = 35)
z <- outer(x, y, function(a, b) a*b^2)
nrz <- nrow(z)
ncz <- ncol(z)
# Create a function interpolating colors in the range of specified colors
jet.colors <- colorRampPalette( c("blue", "green") )
# Generate the desired number of colors from this palette
nbcol <- 100
color <- jet.colors(nbcol)
# Compute the z-value at the facet centres
zfacet <- (z[-1, -1] + z[-1, -ncz] + z[-nrz, -1] + z[-nrz, -ncz])/4
# Recode facet z-values into color indices
facetcol <- cut(zfacet, nbcol)
persp(x, y, z, col = color[facetcol], phi = 30, theta = -30)

labs <- levels(facetcol)
tmp <- cbind(lower = as.numeric( sub("\\((.+),.*", "\\1", labs) ),
      upper = as.numeric( sub("[^,]*,([^]]*)\\]", "\\1", labs) ))

par(mar=c(10,0,10,5))
image(x=1, y=rowMeans(tmp), matrix(rowMeans(tmp), nrow=1, ncol=nbcol), col=color, axes=FALSE, xlab="", ylab="")
axis(4)
box()

enter image description here

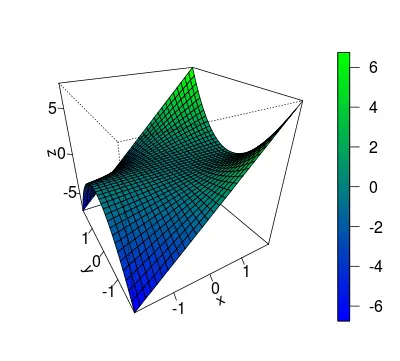
顺便提一下,我意识到persp的最后一个示例在计算面值时似乎有一个错误 - 目前的面值是角落数值的总和,并且需要除以4才能直接使用它们来提取颜色分割点:

# Compute the z-value at the facet centres
zfacet <- z[-1, -1] + z[-1, -ncz] + z[-nrz, -1] + z[-nrz, -ncz]
# Recode facet z-values into color indices
facetcol <- cut(zfacet, nbcol)

#should be:
# Compute the z-value at the facet centres
zfacet <- (z[-1, -1] + z[-1, -ncz] + z[-nrz, -1] + z[-nrz, -ncz]) / 4
# Recode facet z-values into color indices
facetcol <- cut(zfacet, nbcol)

1
我认为你的方法更正确,因为你计算了面的中心值,而不是假设颜色范围从min(z)max(z)。例如,你的条形图从min(zfacet) = -6.750447开始,而min(z) = -7.414875。我也会在我的答案中加入这个 :) - koekenbakker
感谢 :) @koekenbakker 的评论 - Joarder Kamal

网页内容由stack overflow 提供, 点击上面的
可以查看英文原文,
原文链接