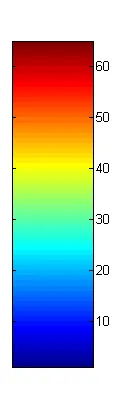
如何在Matlab中仅绘制一个颜色条,比如从-1到1的jet色卡?我需要将其保存为图像。
运行colorbar还会在颜色条旁边绘制一个空轴。
colorbar
axis off
如果您想完全控制色条的宽度和位置,则可以执行以下操作:
fig1=figure;
left=100; bottom=100 ; width=20 ; height=500;
pos=[left bottom width height];
axis off
colorbar([0.1 0.1  0.7  0.8]);
set(fig1,'OuterPosition',pos)
convert 裁剪图像。 - Andreas由于MATLAB只能将图形保存为图像,并且colorbar不返回图形句柄,因此一种方法是安装http://www.mathworks.com/matlabcentral/fileexchange/23629-exportfig,然后使用以下命令:
colormap('jet');
cbar_handle = colorbar;
export_fig(cbar_handle, 'colorbar.png');
colorbar.png:
受bla的启发,这里提供了更多调整选项的答案。(Rep<50表示无法评论,抱歉!)
fig1=figure;
axis off
colormap(gray(100));
caxis([-1 1]);
h = colorbar([0.1 0.1  0.8  0.7],...
  'location','Southoutside',...
  'XTick',[-1 -0.5 0 0.5 1]);
set(h,'OuterPosition',[0.1 0.1 0.8 0.8]);

colorbar。或者colorbar; print mybar。 - Tim