Scipy中的griddata使用'linear'和'cubic'插值方法时出现NaN值

7
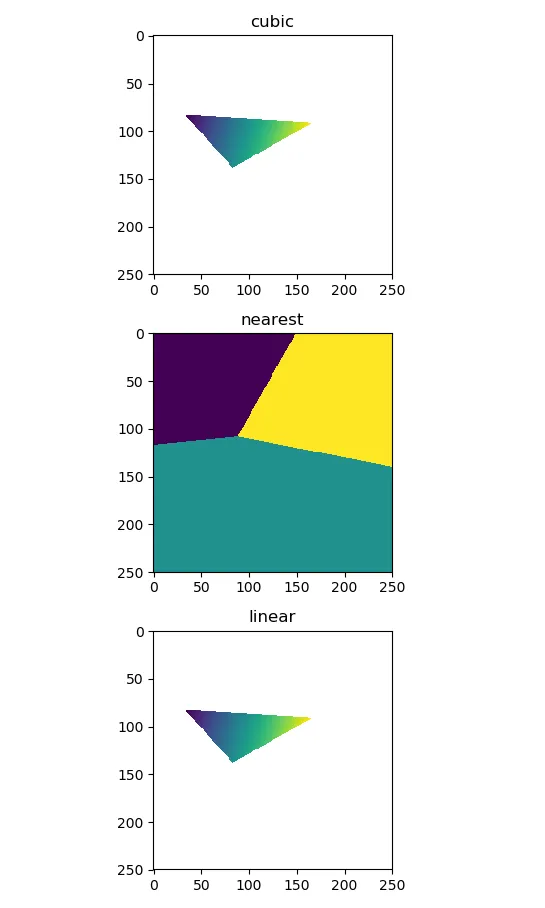
以下代码应该生成griddata。但是,如果我选择插值类型为“cubic”或“linear”,则在z网格中会得到nan。当我选择“nearest”时,一切都正常运行。 这里是一个示例代码:
import numpy as np
from scipy.interpolate import griddata

x = np.array([0.03,0.05,0033])
y = np.array([0.004,0.01,0.02])
z = np.array([1,2,3])


xy = np.zeros((2,np.size(x)))
xy[0] = x
xy[1] = y
xy = xy.T

grid_x, grid_y = np.mgrid[0.0:0.09:250*1j, 0.0:0.03:250*1j] #generating the grid


i_type= 'cubic' #nearest, linear, cubic
grid_z = griddata(xy, z, (grid_x, grid_y), method=i_type)

#check if there is a nan in the z grid:
print np.isnan(grid_z).any()

我不知道为什么这个不能正常工作。

可能是scipy griddata插值返回一个填充了nan的向量的重复问题。 - AGN Gazer
1个回答

9

您所查看的区域比输入点要大得多。对于“nearest”而言,这并不重要,因为它总是将最近的值放在某个坐标上。但是,“linear”和“cubic”不会外推,而是默认用nan填充输入区域之外的值。

还请参阅griddata的文档:

fill_value : float, optional
Value used to fill in for requested points outside of the convex hull of the input points. If not provided, then the default is nan. This option has no effect for the ‘nearest’ method.

最好使用imshow函数绘制的图像可以更容易地理解:

enter image description here

创建此图的代码如下:

import numpy as np
from scipy.interpolate import griddata

x = np.array([0.03,0.05,0.033])
y = np.array([0.004,0.01,0.02])
z = np.array([1,2,3])


xy = np.zeros((2,np.size(x)))
xy[0] = x
xy[1] = y
xy = xy.T

grid_x, grid_y = np.mgrid[0.0:0.09:250*1j, 0.0:0.03:250*1j] #generating the grid

fig, axs = plt.subplots(3)
for i, i_type in enumerate(['cubic', 'nearest', 'linear']): #, cubic
    grid_z = griddata(xy, z, (grid_x, grid_y), method=i_type)

    #check if there is a nan in the z grid:
    axs[i].imshow(grid_z)
    axs[i].set_title(i_type)

plt.tight_layout()

感谢这个有用的回答! - Jan SE
你使用什么模块导入plt? - Camilo
@SpghttCd,您能否解释一下如何访问插值点?比如grd_x[0],grid_y[2]处的值?griddata返回一个二维数组,我不太清楚它是如何映射到由grid_x, grid_y给出的插值点的。 - Alexander Cska

网页内容由stack overflow 提供, 点击上面的
可以查看英文原文,
原文链接