我正在尝试使用颜色在地图上表示两个变量x和y。
目前为止,我能做到的最好的方法是使用一种变量的颜色和另一种变量的透明度。
plt.Polygon(shape.points, fill=False, color=cmap(y), alpha=x)
在matplotlib中是否有可能创建一个二维的颜色映射,以便同时表达这两个变量?
我正在尝试使用颜色在地图上表示两个变量x和y。
目前为止,我能做到的最好的方法是使用一种变量的颜色和另一种变量的透明度。
plt.Polygon(shape.points, fill=False, color=cmap(y), alpha=x)
在matplotlib中是否有可能创建一个二维的颜色映射,以便同时表达这两个变量?
import matplotlib.pyplot as plt
import numpy as np
fig, ax = plt.subplots()
ax.set_aspect("equal")
x = [1,1,2,2,3,3] # xdata
y = [1,2,3,1,2,3] # ydata
p1 = [0.2,0.4,.6,.8,.6,.1] # parameter 1
p2 = [0.4,0.5,.7,.1,.3,.7] # parameter 2
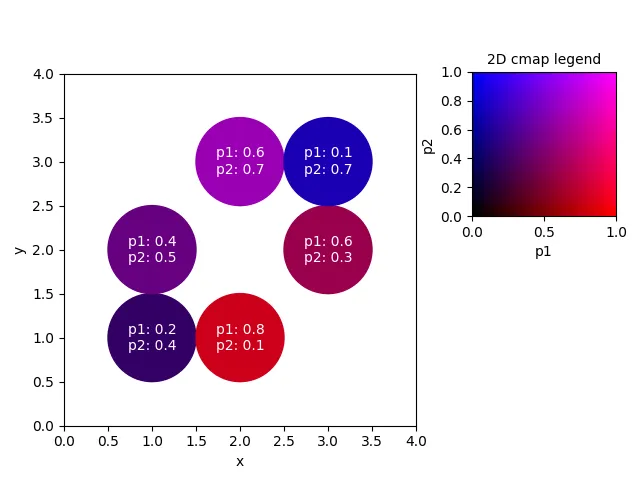
# create a very simple colormap,
# mapping parameter 1 to the red channel and
# parameter 2 to the blue channel
cmap = lambda p1,p2 : (p1, 0, p2)
# put shapes at positions (x[i], y[i]) and colorize them with our
# cmap according to their respective parameters
for i in range(len(x)):
circle = plt.Circle((x[i], y[i]), 0.5, color=cmap(p1[i],p2[i]))
ax.add_artist(circle)
tx="p1: {}\np2: {}".format(p1[i],p2[i]) # create a label
ax.text(x[i], y[i], tx, ha="center", color="w", va="center")
ax.set_xlim(0,4)
ax.set_ylim(0,4)
ax.set_xlabel("x")
ax.set_ylabel("y")
# create the legend:
plt.subplots_adjust(left=0.1, right=0.65, top=0.85)
cax = fig.add_axes([0.7,0.55,0.3,0.3])
cp1 = np.linspace(0,1)
cp2 = np.linspace(0,1)
Cp1, Cp2 = np.meshgrid(cp1,cp2)
C0 = np.zeros_like(Cp1)
# make RGB image, p1 to red channel, p2 to blue channel
Legend = np.dstack((Cp1, C0, Cp2))
# parameters range between 0 and 1
cax.imshow(Legend, origin="lower", extent=[0,1,0,1])
cax.set_xlabel("p1")
cax.set_ylabel("p2")
cax.set_title("2D cmap legend", fontsize=10)
plt.show()
matplotlib.colors.hsv_to_rgb(hsv)可能会有所帮助。有一个适用于2D色图的Javascript插件,可以在这里找到。
将其快速翻译成Python代码可能如下:
# Based on: https://github.com/dominikjaeckle/Color2D

import matplotlib.pyplot as plt
import numpy as np

COLORMAP_FILE = "./bremm.png"


class ColorMap2D:
    def __init__(self, filename=None):
        self._colormap_file = filename or COLORMAP_FILE
        self._img = plt.imread(self._colormap_file)

        self._width = len(self._img[0])
        self._height = len(self._img)

        self._range_x = (0, 1)
        self._range_y = (0, 1)

    def _scale(self, u: float, u_min: float, u_max: float) -> float:
        return ((u + 1) - (u_min + 1)) / ((u_max + 1) - (u_min + 1))

    def _scale_x(self, x: float) -> int:
        val = self._scale(x, self._range_x[0], self._range_x[1])
        return int(val * (self._width - 1))

    def _scale_y(self, y: float) -> int:
        val = self._scale(y, self._range_y[0], self._range_y[1])
        return int(val * (self._height - 1))

    def __call__(self, X):
        assert len(X.shape) == 2

        self._range_x = (X[:, 0].min(), X[:, 0].max())
        self._range_y = (X[:, 1].min(), X[:, 1].max())

        output = np.zeros((X.shape[0], 3))
        for i in range(X.shape[0]):
            x, y = X[i, :]
            xp = self._scale_x(x)
            yp = self._scale_y(y)
            output[i, :] = self._img[xp, yp]
        return output
这需要在同一目录下有 bremm.png 文件才能正常使用。
您可以像使用其他 Matplotlib 色彩映射一样使用它:
cmap = ColorMap2D()
colors = cmap(array)
其中array是一个N x 2的矩阵,包含了(x, y)坐标。
_scale 的减法两侧都加 1?它可以简单地写成 (u - u_min) / (u_max - u_min)。2)len(X.shape) 等同于 X.ndim(而 X.shape[0] 等同于 len(X))。 - Neinstein