在jupyter笔记本中使用seaborn绘制双坐标轴图时,我遇到了一个问题。重要提示:该代码在Python 2中运行非常良好。
升级到anaconda的Python 3后,我收到了以下错误消息:
/Users/enyi/opt/anaconda3/lib/python3.7/site-packages/seaborn/categorical.py:3720: UserWarning: catplot is a figure-level function and does not accept target axes. You may wish to try countplot
  warnings.warn(msg, UserWarning)
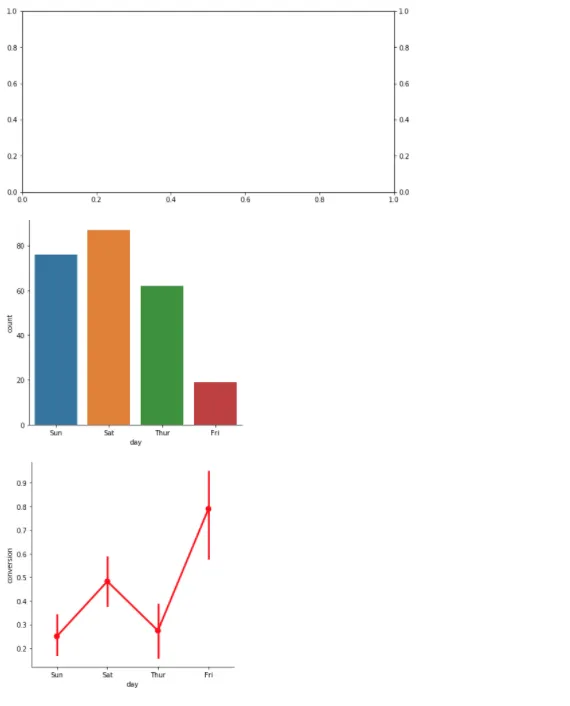
以下是您的代码的输出图像:
import pandas as pd
import matplotlib.pyplot as plt
import seaborn as sns

df = pd.read_csv('tips.csv')

fig, ax = plt.subplots(1,2,figsize = (10,5))

sns.catplot(x='sex', hue = 'group', data= df, kind = 'count', ax=ax[0])
sns.catplot(x='sex', y='conversion',hue = 'group', data= df, kind = 'bar',ax=ax[2])

plt.show()