我有一个数据框 tbl,其中包含以下数据:
library(tibble)

tbl <- structure(list(
    year = c(2007, 2008, 2008, 2009, 2009, 2010, 2010, 2010, 2011, 2011, 2011, 2011, 2012, 2012, 2012, 2013, 2013, 2013, 2014, 2014, 2014, 2015, 2015, 2015, 2015, 2016, 2016, 2016, 2016, 2017, 2017, 2017, 2018, 2018, 2018, NA),
    Type = c("RLR", "PLR", "RLR", "PLR", "RLR", "PLR", "RLR", "RR", "PLR", "RLR", "RR", "Supplement", "PLR", "RLR", "RR", "PLR", "RLR", "RR", "PLR", "RLR", "RR", "LR", "PLR", "RLR", "RR", "LR", "Other", "PLR", "RR", "LR", "Other", "RR", "LR", "Other", "RR", "RR"),
    `n()` = c(4L, 2L, 35L, 14L, 41L, 34L, 37L, 61L, 40L, 21L, 149L, 1L, 38L, 17L, 134L, 41L, 4L, 115L, 23L, 3L, 76L, 1L, 27L, 2L, 78L, 28L, 2L, 4L, 36L, 33L, 5L, 32L, 22L, 3L, 36L, 5L)),
  row.names = c(NA, -36L),
  class = c("grouped_df", "tbl_df", "tbl", "data.frame"),
  groups = structure(list(
    year = c(2007, 2008, 2009, 2010, 2011, 2012, 2013, 2014, 2015, 2016, 2017, 2018, NA),
    .rows = list(1L, 2:3, 4:5, 6:8, 9:12, 13:15, 16:18, 19:21, 22:25, 26:29, 30:32, 33:35, 36L)),
  row.names = c(NA, -13L),
  class = c("tbl_df", "tbl", "data.frame"),
  .drop = TRUE))
我想创建一个分层面积图(堆叠图),使用以下代码:
ggplot(tbl,aes(x=year,y=`n()`,fill=Type)) +
geom_area(position="stack") +
theme_light() +
scale_colour_brewer(type="qual",palette = 1) +
ylab("Count")
但是我得到的结果在一些图层之间有奇怪的空白间隙:
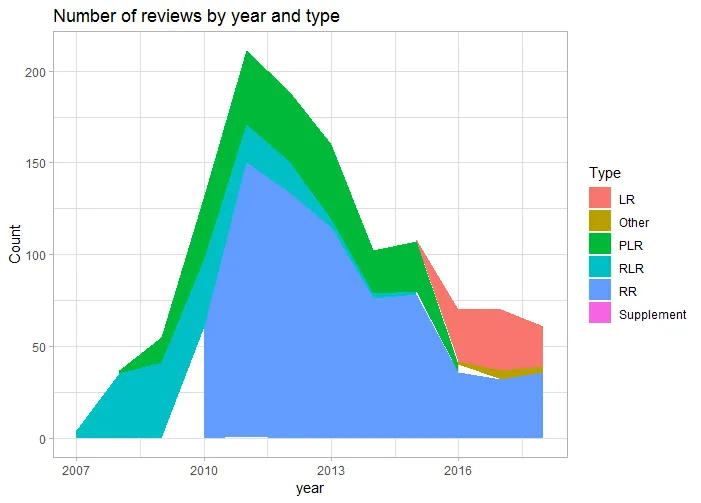
我找到了这个问题,但这似乎不是我遇到的问题 - 我的数据中没有负数。
有什么想法可以解决这个问题吗?
这里似乎正在发生:不同时间将从完整列表中添加新的Type并删除旧的Type。当发生这种情况时,这些区域的起点是一个垂直直线,但上方Type的区域会从0斜向上走到这个图层的新起点。这对我来说不像是合理的行为。如何让ggplot将所有颜色都绘制在彼此上方而不是尝试创建带状条纹?我认为这是geom_area的全部意义所在…

expand.grid和full_join或pivot_wider后跟pivot_longer显式创建缺失行,如此博客文章所述(使用旧名称spread和gather)。 - Paul Rougieux