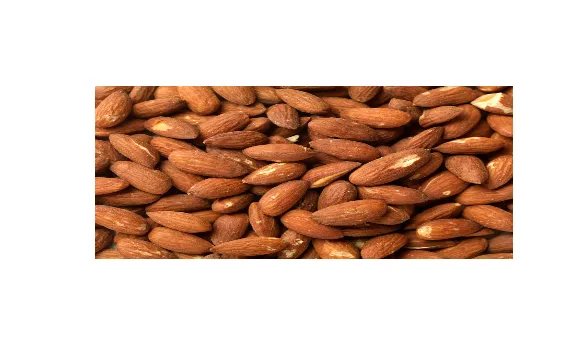
我想要测量一个JPEG图像中白/黄色的数量(可以调整容差)。我正在尝试开发一个质量控制工具,用于检测杏仁的缺陷。这些缺陷是棕色杏仁皮肤上的划痕(如下图所示)。由于这些缺陷是白/黄色的,我希望能够简单地将图像加载到R中,并测量图像中白色区域的数量。然后我可以实验性地确定可接受的水平。所有图像的大小都相同。
卡尔的回答已经解决了99%的问题,这里有一点补充,可以测量图像中白色/接近白色部分的数量:
# Required package
library(jpeg)

# Load and plot data
jpg <- "C:\\my_image.jpg"
my_jpg <- readJPEG(jpg)

# or for stand-alone reproducibility:
# my_jpg <- readJPEG(system.file("img", "Rlogo.jpg", package="jpeg"))

# have a look at the original image
plot(0:1,0:1,type="n",ann=FALSE,axes=FALSE)
rasterImage(my_jpg,0,0,1,1)
# prints the jpg, just to make sure it's gone in ok
# Following Carl's example, subset each channel to get
# the pixels with white values (ie. close to 1) and make
# non-white pixels black for convienence. As Carl says,
# you'll need to adjust the values from 0.99 for your
# use case
white_red_channel <- ifelse(my_jpg[,,1] > 0.99, 1,0)
white_green_channel <- ifelse(my_jpg[,,2] > 0.99, 1,0)
white_blue_channel <- ifelse(my_jpg[,,3] > 0.99, 1,0)
# combine channels into array
white <- simplify2array(list(white_red_channel,
white_green_channel,
white_blue_channel))
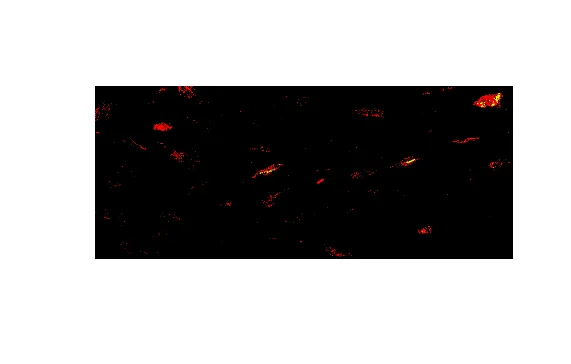
# plot white/near-white pixels only
plot(0:1,0:1,type="n",ann=FALSE,axes=FALSE)
rasterImage(white, 0, 0, 1, 1)
# looks pretty good, whiter areas on original are highlighted here:
# find proportion of image that is not black
whites <- white_red_channel + white_green_channel + white_blue_channel # sum channels
not_black <- sum(whites > 0) # count pixels that are not black
total_pixels <- ncol(whites) * nrow(whites) # find total number of pixels
not_black / total_pixels # proportion of non-black pixels
[1] 0.01390833
正如BondedDust所建议的那样,将其栅格化会更容易,但无论如何,您需要定义符合缺陷标准的颜色范围(RGB或其他方式)。
请考虑以下内容:
library(jpeg)
foo <- readJPEG('foo.jpeg')  #returns a NxMx3 array

# find qualifiers in each layer for lmit values you chose
badred <-which(foo[,,1] > redlimit, arr.ind=TRUE)
badgreen <-which(foo[,,2] > greenlimit, arr.ind=TRUE)
badblue <-which(foo[,,3] > bluelimit, arr.ind=TRUE)
这给了你三个包含行列索引对的矩阵。找到匹配的对(有一些快速的方法来完成,但我现在自然而然地忘记了:-( )。或者您可以绘制所有三个矩阵并观察重叠区域:
plot(badred[,1],badred[,2],pch=19,cex=.5,col='red')
points(badgreen[,1],badgreen[,2],pch=19,cex=.5,col='green')
points(badblue[,1],badblue[,2],pch=19,cex=.5,col='blue')
我建议采取不同的方法。在YCbCR颜色空间中工作。Y通道是黑白白色。如果你只想要白色,可以仅在Y通道中找到。
高Y值=白色。 低Y值=黑色。
我想象一些截止值(超过200)会表示白色。