用ggplot绘制具有区域和轮廓的geom_area图

9

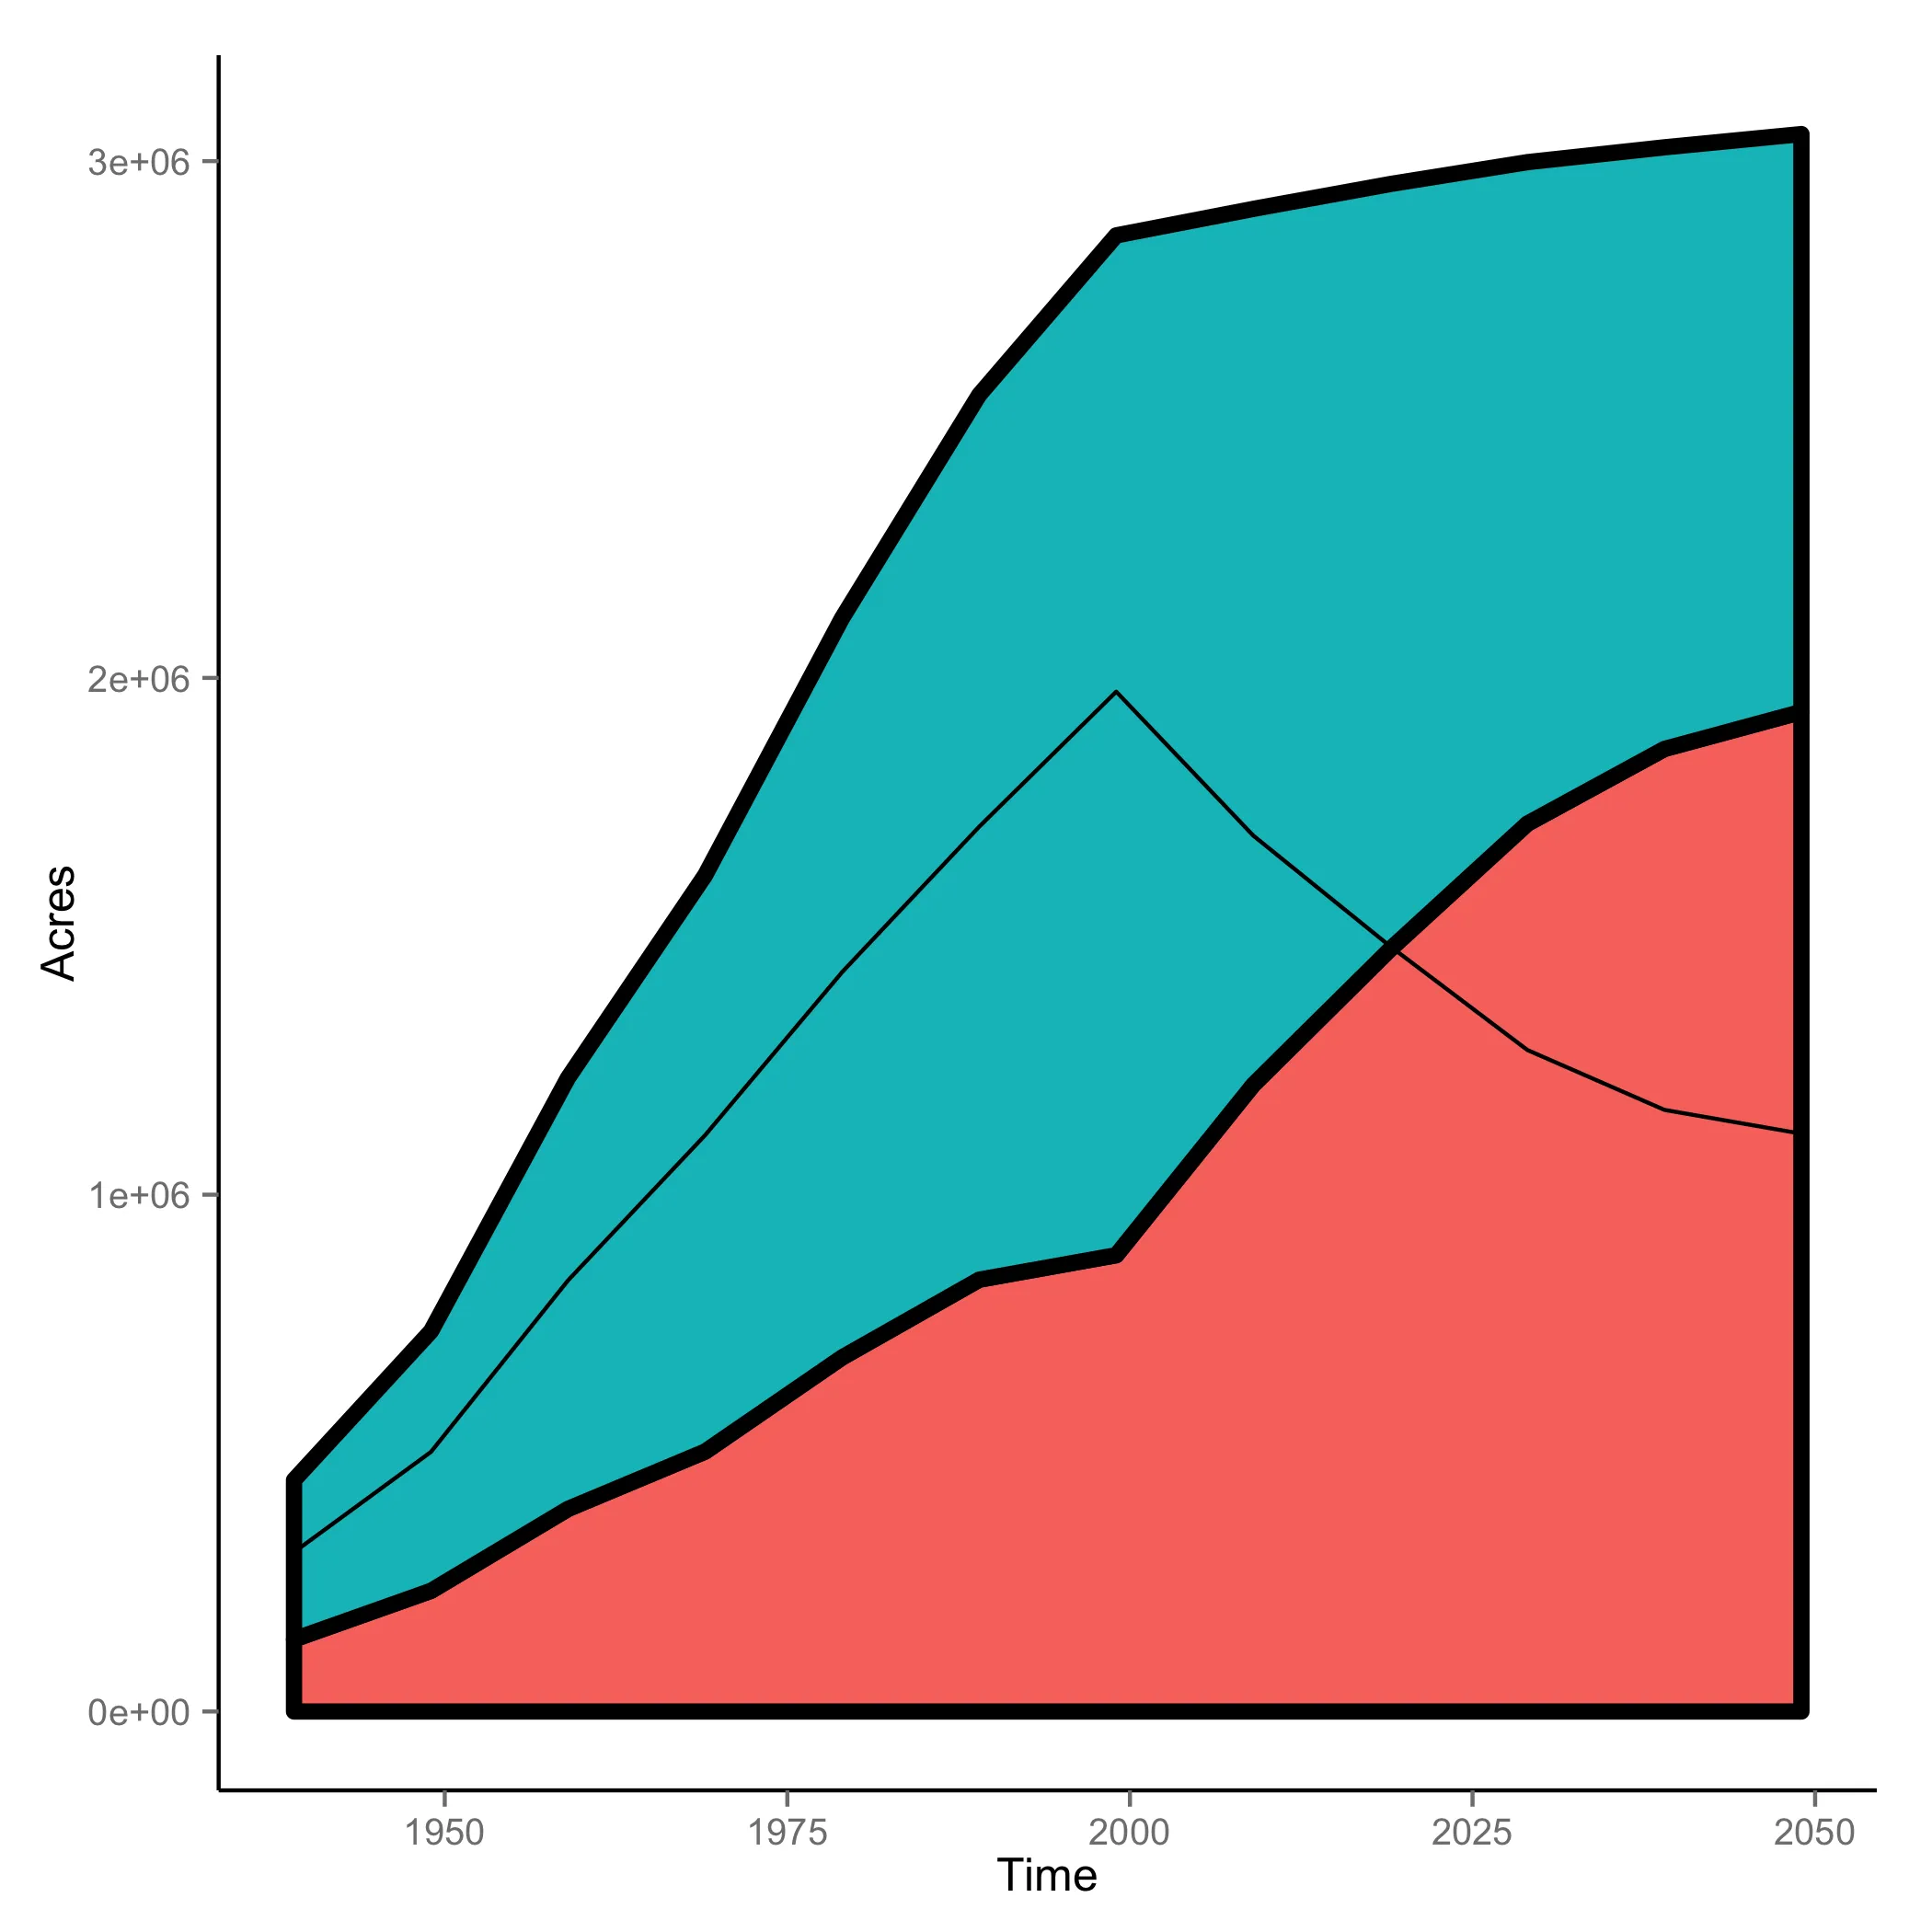
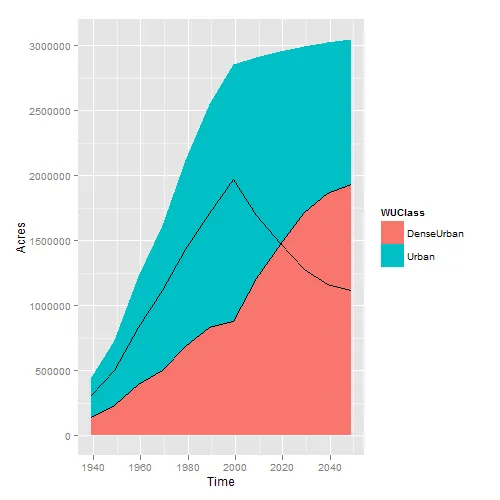
我正在尝试创建一个堆叠的geom_area图,但是希望用线条勾勒出每个区域图(对第一个“红色”区域有效,但对蓝色无效)。这是我最好的努力,但我无法弄清楚如何使线型也堆叠起来。有什么想法吗?

示例

df= data.frame(Time=as.numeric(strsplit('1939 1949 1959 1969 1979 1989 1999 2009 2019 2029 2039 2049 1939 1949 1959 1969 1979 1989 1999 2009 2019 2029 2039 2049', split=' ')[[1]] ),
               Acres=as.numeric(strsplit('139504.2 233529.0 392105.3 502983.9 685159.9 835594.7 882945.1 1212671.4 1475211.9 1717971.7 1862505.7 1934308.0 308261.4 502460.8 834303.1 1115150.7 1430797.8 1712085.8 1973366.1 1694907.7 1480506.0 1280047.6 1164200.5 1118045.3', split=' ')[[1]] ),
               WUClass= strsplit('DenseUrban DenseUrban DenseUrban DenseUrban DenseUrban DenseUrban DenseUrban DenseUrban DenseUrban DenseUrban DenseUrban DenseUrban Urban Urban Urban Urban Urban Urban Urban Urban Urban Urban Urban Urban', split=' ')[[1]]   
               )

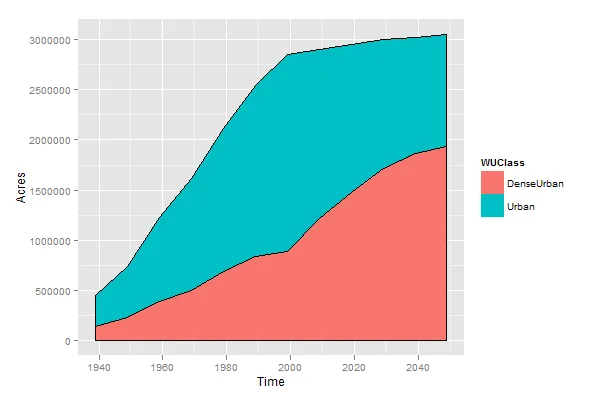
a=ggplot(df,aes(x = Time,y = Acres,fill=WUClass))+ geom_area( position = 'stack'  )
plot(a)
a+ geom_line(aes(position = 'stack'))
3个回答

9
为了在区域中添加轮廓,请仅更改 colour
ggplot(df,aes(x = Time,y = Acres,fill=WUClass)) +
  geom_area( position = 'stack') +
  geom_area( position = 'stack', colour="black", show_guide=FALSE)

但是要画出这些线,请按照以下步骤操作:
ggplot(df,aes(x = Time, y = Acres, fill=WUClass, group=WUClass)) +
  geom_area() + geom_line(aes(ymax=Acres), position="stack")

enter image description here


6

我将线宽设置得非常大,只是为了说明差异。

ggplot(df,aes(x = Time, y = Acres, fill = WUClass)) + 
geom_area( position = 'stack', linetype = 1, size =2 ,colour="black" , 
show_guide=FALSE) +
geom_line(aes(position = 'stack'))

enter image description here


谢谢Maiasaura!虽然我更喜欢其他人的答案,因为我不必担心图例中的线。 - mmann1123

5
错误在于您将position="stack"放置在aes()内部。请更改为:
a=ggplot(df,aes(x = Time,y = Acres, fill=WUClass))+
                   geom_area( position = 'stack'  )
a +geom_line( position = 'stack'  )

...一切都很好。


网页内容由stack overflow 提供, 点击上面的
可以查看英文原文,
原文链接