我的问题
假设我有这样的一个Series。
In[10]: month_series
Out[10]:
2016-01-01    4880
2016-02-01    4579
2016-03-01    6726
2016-04-01    1778
2016-05-01    3303
2016-06-01    5402
2016-07-01    1207
2016-08-01    6176
2016-09-01    5586
2016-10-01    2802
2016-11-01    6944
2016-12-01    3580
2017-01-01    9336
dtype: int64
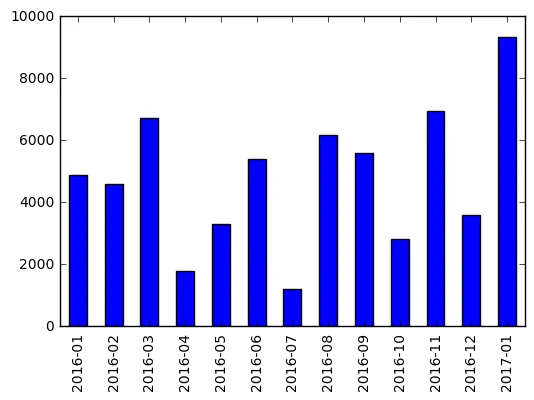
我只想制作一个条形图来比较月份之间的差异,这似乎非常简单,使用
In[11]: month_series.plot(kind='bar')
Out[11]:
我其实不需要太多,但我的问题是x轴上的日期看起来很糟糕 - 我想要格式化日期,只提供年份和月份,例如%Y-%m这样的格式。 我该如何做到这一点?
我的困扰
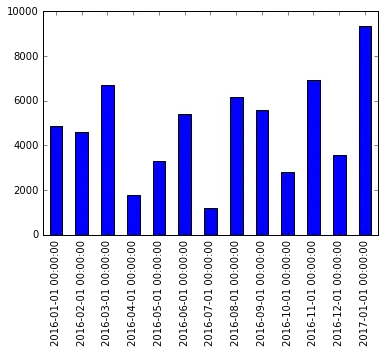
因此,查看pandas.Series.plot的文档,我看到可以传递的xticks参数,并想到可以使用strftime格式化日期并作为序列传递。但是这样不起作用,因为刻度需要数字值或日期,而不是字符串。
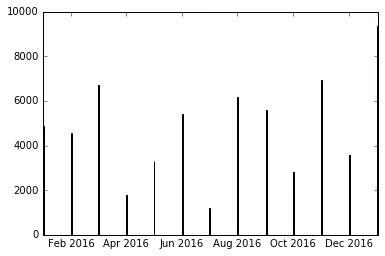
然后我想我应该只使用原始的matplotlib,这样我就可以使用set_major_formatter和DateFormatter来修改刻度标签。但是如果我只使用plt.bar,那么会引入一个新问题-整个日期范围都被使用,这是有道理的。
In[17]: plt.bar(month_sereis.index, month_sereis.values)
Out[17]: <Container object of 13 artists>
目前为止,我相信我错过了什么,而且有一种简单的方法可以做到这一点。