在Python中检测OHLC数据的模式

4

我有以下一组OHLC数据:

[[datetime.datetime(2020, 7, 1, 6, 30), '0.00013449', '0.00013866', '0.00013440', '0.00013857', '430864.00000000', 1593579599999, '59.09906346', 1885, '208801.00000000', '28.63104974', '0', 3.0336828016952944], [datetime.datetime(2020, 7, 1, 7, 0), '0.00013854', '0.00013887', '0.00013767', '0.00013851', '162518.00000000', 1593581399999, '22.48036621', 809, '78014.00000000', '10.79595625', '0', -0.02165439584236435], [datetime.datetime(2020, 7, 1, 7, 30), '0.00013851', '0.00013890', '0.00013664', '0.00013780', '313823.00000000', 1593583199999, '43.21919087', 1077, '157083.00000000', '21.62390537', '0', -0.5125983683488642], [datetime.datetime(2020, 7, 1, 8, 0), '0.00013771', '0.00013818', '0.00013654', '0.00013707', '126925.00000000', 1593584999999, '17.44448931', 428, '56767.00000000', '7.79977280', '0', -0.46474475346744676], [datetime.datetime(2020, 7, 1, 8, 30), '0.00013712', '0.00013776', '0.00013656', '0.00013757', '62261.00000000', 1593586799999, '8.54915420', 330, '26921.00000000', '3.69342184', '0', 0.3281796966161107], [datetime.datetime(2020, 7, 1, 9, 0), '0.00013757', '0.00013804', '0.00013628', '0.00013640', '115154.00000000', 1593588599999, '15.80169390', 510, '52830.00000000', '7.24924784', '0', -0.8504761212473579], [datetime.datetime(2020, 7, 1, 9, 30), '0.00013640', '0.00013675', '0.00013598', '0.00013675', '66186.00000000', 1593590399999, '9.02070446', 311, '24798.00000000', '3.38107106', '0', 0.25659824046919455], [datetime.datetime(2020, 7, 1, 10, 0), '0.00013655', '0.00013662', '0.00013577', '0.00013625', '56656.00000000', 1593592199999, '7.71123423', 367, '27936.00000000', '3.80394497', '0', -0.2196997436836377], [datetime.datetime(2020, 7, 1, 10, 30), '0.00013625', '0.00013834', '0.00013625', '0.00013799', '114257.00000000', 1593593999999, '15.70194874', 679, '56070.00000000', '7.70405037', '0', 1.2770642201834814], [datetime.datetime(2020, 7, 1, 11, 0), '0.00013812', '0.00013822', '0.00013630', '0.00013805', '104746.00000000', 1593595799999, '14.39147417', 564, '46626.00000000', '6.39959586', '0', -0.05068056762237037], [datetime.datetime(2020, 7, 1, 11, 30), '0.00013805', '0.00013810', '0.00013720', '0.00013732', '37071.00000000', 1593597599999, '5.10447229', 231, '16349.00000000', '2.25258584', '0', -0.5287939152480996], [datetime.datetime(2020, 7, 1, 12, 0), '0.00013733', '0.00013741', '0.00013698', '0.00013724', '27004.00000000', 1593599399999, '3.70524540', 161, '15398.00000000', '2.11351192', '0', -0.06553557125171522], [datetime.datetime(2020, 7, 1, 12, 30), '0.00013724', '0.00013727', '0.00013687', '0.00013717', '27856.00000000', 1593601199999, '3.81864840', 140, '11883.00000000', '1.62931445', '0', -0.05100553774411102], [datetime.datetime(2020, 7, 1, 13, 0), '0.00013716', '0.00013801', '0.00013702', '0.00013741', '83867.00000000', 1593602999999, '11.54964001', 329, '42113.00000000', '5.80085155', '0', 0.18226888305628908], [datetime.datetime(2020, 7, 1, 13, 30), '0.00013741', '0.00013766', '0.00013690', '0.00013707', '50299.00000000', 1593604799999, '6.90474065', 249, '20871.00000000', '2.86749244', '0', -0.2474346845207872], [datetime.datetime(2020, 7, 1, 14, 0), '0.00013707', '0.00013736', '0.00013680', '0.00013704', '44745.00000000', 1593606599999, '6.13189248', 205, '14012.00000000', '1.92132206', '0', -0.02188662727072625], [datetime.datetime(2020, 7, 1, 14, 30), '0.00013704', '0.00014005', '0.00013703', '0.00013960', '203169.00000000', 1593608399999, '28.26967457', 904, '150857.00000000', '21.00600041', '0', 1.8680677174547595]]
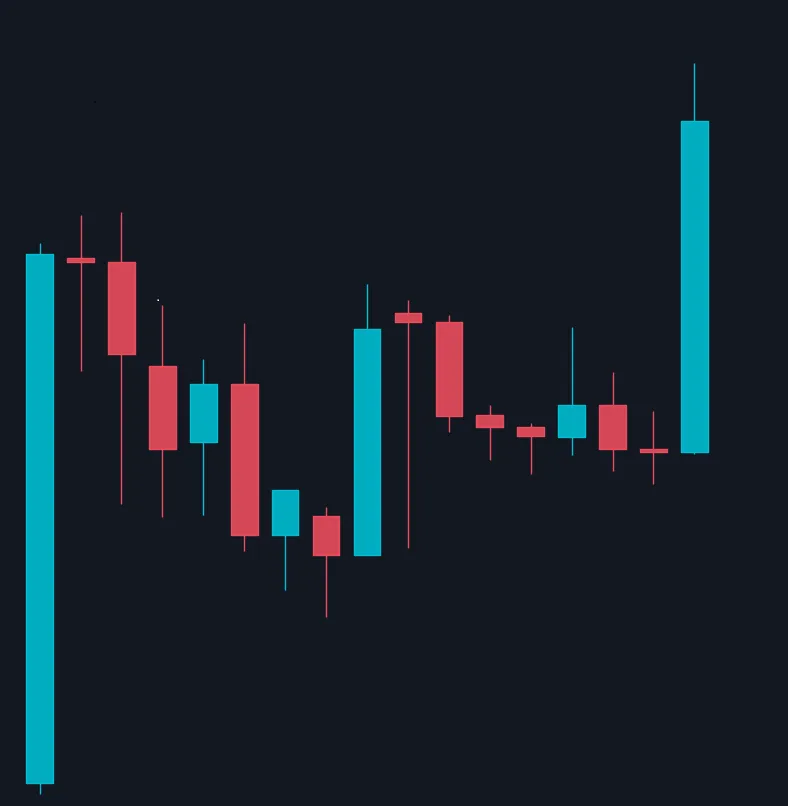
那看起来像这样: 
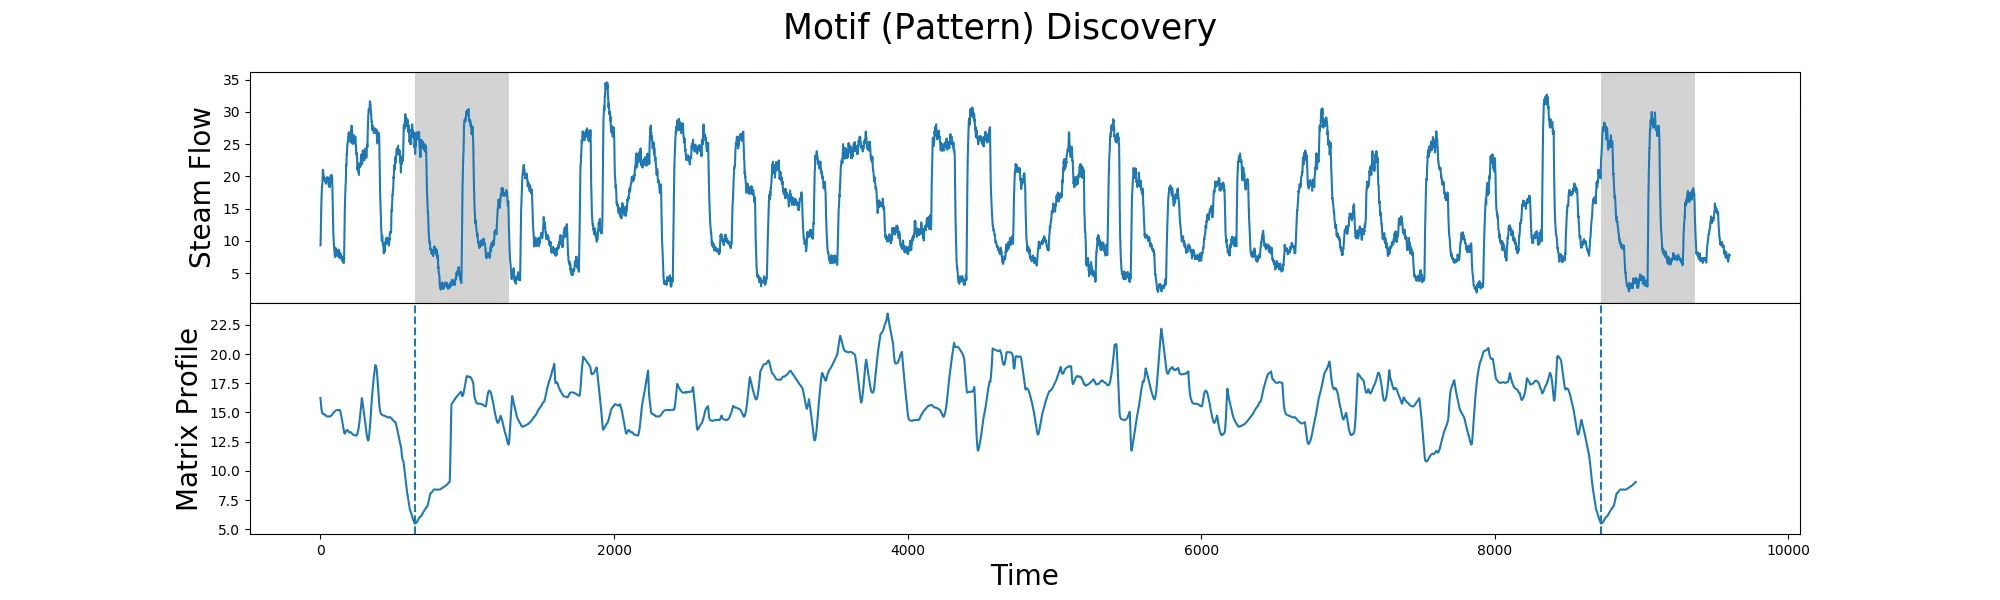
我正在尝试在其他一组OHLC数据中检测类似上述图案的模式。它不必完全相同,只需要是相似的,即蜡烛数量不一定相同,只需要形状相似。
问题是: 我不知道从哪里开始才能实现这一点。我知道这并不容易,但我相信有一种方法可以做到这一点。
我已经尝试过: 到目前为止,我只设法手动削减掉我不需要的OHLC数据,以便我只拥有我想要的模式。然后,我使用Pandas DataFrame绘制了它。
import mplfinance as mpf
import numpy as np
import pandas as pd

df = pd.DataFrame([x[:6] for x in OHLC], 
                          columns=['Date', 'Open', 'High', 'Low', 'Close', 'Volume'])

format = '%Y-%m-%d %H:%M:%S'
df['Date'] = pd.to_datetime(df['Date'], format=format)
df = df.set_index(pd.DatetimeIndex(df['Date']))
df["Open"] = pd.to_numeric(df["Open"],errors='coerce')
df["High"] = pd.to_numeric(df["High"],errors='coerce')
df["Low"] = pd.to_numeric(df["Low"],errors='coerce')
df["Close"] = pd.to_numeric(df["Close"],errors='coerce')
df["Volume"] = pd.to_numeric(df["Volume"],errors='coerce')


mpf.plot(df, type='candle', figscale=2, figratio=(50, 50))
我的想法: 解决该问题的一个可能方法是使用神经网络,因此我需要将我想要的图案的图像馈送到神经网络中,让神经网络循环浏览其他图表并查看是否可以找到我指定的图案。在采取这种方式之前,我正在寻找更简单的解决方案,因为我对神经网络不太了解,也不知道我需要什么类型的神经网络以及应该使用哪些工具。

另一种解决方案是:我需要以某种方式将我想要在其他数据集上查找的模式转换为一系列值。因此,例如,我上面发布的OHLC数据将被量化,并且在另一组OHLC数据中,我只需要找到接近我想要的模式的值。目前,这种方法非常实证,我不知道如何将其放入代码中。

一个被建议使用的工具:Stumpy

我需要的内容: 我不需要精确的代码,我只需要一个示例、一篇文章、一个库或任何可以指导我如何检测我指定的某个模式在OHLC数据集上工作的资源。我希望我已经足够明确;感谢任何形式的建议!

您希望形状以何种方式相似?是指当天的价格相似吗?开盘/收盘相似吗?最高/最低相似吗?还是以上所有因素的某种组合? - Salvatore
请查看我附加的图表,将其从蜡烛图转换为折线图。我的目标是使用另一个图表并检测何时它与我选择的图表相似。因此,基本上我需要告诉我的代码:“当价格上涨,然后价格在一段时间内保持不变时,请检测”。 - Jack022
由于该问题已关闭,您的悬赏已退还。如果您编辑问题使其更加专注,并重新提供悬赏,我很乐意再次提供帮助。 - Salvatore
1
@MatthewSalvatoreViglione 是的,问题确实被关闭了。我创建了一个新的问题,应该更加具体和专注,明天我会开始为它设置赏金,一旦SO允许我这样做。如果你想看一下,这样我也可以奖励你,请看这里:https://stackoverflow.com/questions/62861895/detecting-patterns-from-two-arrays-of-data-in-python - Jack022
1个回答

5

Stumpy是一个适用于您的工具。

基本方法

该算法的基本思想是计算数据流的矩阵轮廓,然后使用它来查找相似区域。(您可以将矩阵轮廓视为滑动窗口,它使用Z-标准化欧几里得距离来评估两个模式的匹配程度。)

这篇文章以相当简单易懂的方式解释了矩阵轮廓。以下是一段解释所需内容的摘录:

简单地说,主题是时间序列中的重复模式,而不和谐是异常。 通过计算矩阵轮廓,可以轻松找到前K个主题或不和谐之一。 矩阵轮廓存储欧几里得空间中的距离,这意味着距离接近0最类似于时间序列中的另一个子序列,而距离远离0(例如100)则不像任何其他子序列。提取最低距离即可得到主题,而最大距离则给出不和谐。

此处介绍了使用矩阵轮廓的好处。

您要做的基本思想是计算矩阵轮廓,然后查找极小值。极小值表示滑动窗口匹配了另一个地方。

此示例显示了如何在一个数据集中查找重复模式:

enter image description here

为了自己再现它们的结果,我导航到DAT文件并自行下载,然后打开并读取它,而不是使用其损坏的urllib调用来获取数据。

替换

context = ssl.SSLContext()  # Ignore SSL certificate verification for simplicity
url = "https://www.cs.ucr.edu/~eamonn/iSAX/steamgen.dat"
raw_bytes = urllib.request.urlopen(url, context=context).read()
data = io.BytesIO(raw_bytes)

使用

steam_df = None
with open("steamgen.dat", "r") as data:
    steam_df = pd.read_csv(data, header=None, sep="\s+")

我还需要添加一些 plt.show() 调用,因为我在 Jupyter 之外运行它。通过这些调整,你可以运行他们的示例并查看其工作原理。

以下是我使用的完整代码,这样你就不必重复我的工作:

import pandas as pd
import stumpy
import numpy as np
import matplotlib.pyplot as plt
from matplotlib.patches import Rectangle
import urllib
import ssl
import io
import os


def change_plot_size(width, height, plt):
    fig_size = plt.rcParams["figure.figsize"]
    fig_size[0] = width
    fig_size[1] = height
    plt.rcParams["figure.figsize"] = fig_size
    plt.rcParams["xtick.direction"] = "out"


change_plot_size(20, 6, plt)

colnames = ["drum pressure", "excess oxygen", "water level", "steam flow"]

context = ssl.SSLContext()  # Ignore SSL certificate verification for simplicity
url = "https://www.cs.ucr.edu/~eamonn/iSAX/steamgen.dat"
raw_bytes = urllib.request.urlopen(url, context=context).read()
data = io.BytesIO(raw_bytes)

steam_df = None
with open("steamgen.dat", "r") as data:
    steam_df = pd.read_csv(data, header=None, sep="\s+")


steam_df.columns = colnames
steam_df.head()


plt.suptitle("Steamgen Dataset", fontsize="25")
plt.xlabel("Time", fontsize="20")
plt.ylabel("Steam Flow", fontsize="20")
plt.plot(steam_df["steam flow"].values)
plt.show()

m = 640
mp = stumpy.stump(steam_df["steam flow"], m)
true_P = mp[:, 0]

fig, axs = plt.subplots(2, sharex=True, gridspec_kw={"hspace": 0})
plt.suptitle("Motif (Pattern) Discovery", fontsize="25")

axs[0].plot(steam_df["steam flow"].values)
axs[0].set_ylabel("Steam Flow", fontsize="20")
rect = Rectangle((643, 0), m, 40, facecolor="lightgrey")
axs[0].add_patch(rect)
rect = Rectangle((8724, 0), m, 40, facecolor="lightgrey")
axs[0].add_patch(rect)
axs[1].set_xlabel("Time", fontsize="20")
axs[1].set_ylabel("Matrix Profile", fontsize="20")
axs[1].axvline(x=643, linestyle="dashed")
axs[1].axvline(x=8724, linestyle="dashed")
axs[1].plot(true_P)


def compare_approximation(true_P, approx_P):
    fig, ax = plt.subplots(gridspec_kw={"hspace": 0})

    ax.set_xlabel("Time", fontsize="20")
    ax.axvline(x=643, linestyle="dashed")
    ax.axvline(x=8724, linestyle="dashed")
    ax.set_ylim((5, 28))
    ax.plot(approx_P, color="C1", label="Approximate Matrix Profile")
    ax.plot(true_P, label="True Matrix Profile")
    ax.legend()
    plt.show()


approx = stumpy.scrump(steam_df["steam flow"], m, percentage=0.01, pre_scrump=False)
approx.update()
approx_P = approx.P_

seed = np.random.randint(100000)
np.random.seed(seed)
approx = stumpy.scrump(steam_df["steam flow"], m, percentage=0.01, pre_scrump=False)

compare_approximation(true_P, approx_P)

# Refine the profile

for _ in range(9):
    approx.update()

approx_P = approx.P_

compare_approximation(true_P, approx_P)

# Pre-processing

approx = stumpy.scrump(
    steam_df["steam flow"], m, percentage=0.01, pre_scrump=True, s=None
)
approx.update()
approx_P = approx.P_

compare_approximation(true_P, approx_P)

自连接 vs 目标连接

请注意,此示例是一个“自连接”,意味着它在自己的数据中查找重复模式。您将想要连接您要匹配的目标。

查看 stumpy.stump 的签名可以告诉您如何执行此操作:

def stump(T_A, m, T_B=None, ignore_trivial=True):
    """
    Compute the matrix profile with parallelized STOMP

    This is a convenience wrapper around the Numba JIT-compiled parallelized
    `_stump` function which computes the matrix profile according to STOMP.

    Parameters
    ----------
    T_A : ndarray
        The time series or sequence for which to compute the matrix profile

    m : int
        Window size

    T_B : ndarray
        The time series or sequence that contain your query subsequences
        of interest. Default is `None` which corresponds to a self-join.

    ignore_trivial : bool
        Set to `True` if this is a self-join. Otherwise, for AB-join, set this
        to `False`. Default is `True`.

    Returns
    -------
    out : ndarray
        The first column consists of the matrix profile, the second column
        consists of the matrix profile indices, the third column consists of
        the left matrix profile indices, and the fourth column consists of
        the right matrix profile indices.

您需要做的是将您想要查找的数据(模式)作为T_B传递,然后将您想要查找的更大的集合作为T_A传递。窗口大小指定了您想要搜索的区域的大小(我想这可能是您的T_B数据的长度,或者如果您需要较小的话,可以更小)。
一旦您获得了矩阵文件,您将只需要执行一个简单的搜索,并获取最低值的指数。每个以该索引开头的窗口都是一个好的匹配。您可能还想定义一些阈值最小值,以便只有在矩阵文件中至少有一个值低于该最小值时才将其视为匹配。
另一件要注意的事情是,您的数据集实际上是几个相关数据集(Open、High、Low、Close和Volume)。您将不得不决定要匹配哪个。也许你只想找到好的开盘价匹配,或者你想找到所有股价的好匹配。您必须决定什么是良好的匹配,并为每个计算矩阵,然后决定如果只有一个或几个子集匹配怎么办。例如,一个数据集的开盘价格可能很匹配,但收盘价格可能匹配不上。另一个数据集的交易量可能匹配,而其他方面则不匹配。也许你想看看归一化的价格是否匹配(这意味着你只会看形状,而不是相对大小,即一支股票从1美元涨到10美元看起来与一支从10美元涨到100美元的股票看起来相同)。只要您能够计算矩阵文件,所有这些都很简单。

这非常有帮助。所以我想要理解两件事:我如何将数据提供给Stumpy?我只需要将我的OHLC数据转换为ndarray并将其提供给Stumpy吗?第二个问题:您说“标准化数据”,那么我不需要以某种方式对数据进行标准化吗?我的意思是,如果一支股票的价格是100美元,另一支股票的价格是1美元,那么对于Stumpy来说它们是相同的吗?如果我标准化我的数据会更容易让Stumpy找到模式吗? - Jack022
最后一部分正是我需要做的:我只想看形状;这意味着我需要应用某种归一化,但我不知道如何在OHLC数据中实现。 - Jack022
1
你需要将每个指标作为单独的数组传递。例如,首先只输入高点并匹配它们。然后是低点、开盘价和收盘价(顺序不重要)。如果您想匹配所有这些内容,则需要为每个指标创建一个矩阵,并且您需要检测所有矩阵都返回低值的情况。如果您只关心其中一两个指标,则只需处理这些指标即可。 - Salvatore
关于归一化,他们的算法中似乎欧几里得距离已经被归一化了,但他们可能指的是其他东西。最简单的方法就是尝试两种方式并查看哪种方式能够获得更好的匹配。当我说归一化时,我的意思是缩放数值以使其在相似范围内。 - Salvatore
1
这在 STUMPY 教程中没有记录,但是当您有一个已知的模式时,我建议使用以下答案,该答案利用了 STUMPY 的 mass 函数:https://stackoverflow.com/a/63368206/2955541 - slaw
@MatthewSalvatoreViglione,您能详细说明一下您所说的“使用他们损坏的urllib调用来获取数据”是什么意思吗?我刚刚执行了最后的示例教程,并成功地检索到了数据,没有任何问题。 - slaw

网页内容由stack overflow 提供, 点击上面的
可以查看英文原文,
原文链接