我们有N个用户,每个用户的平均得分为P,其中每个得分都是0到1之间的单个值。由于这些得分存在一定的不确定性,我们需要使用已知密度为0.05的正态分布来分配每个点的质量。此外,我们需要将质量包裹在0和1周围,例如,一个位于0.95的点也会在0周围分配质量。我在下面提供了一个工作示例,它将正态分布分成D=50个bin。该示例使用Python的typing模块,但如果您愿意,可以忽略它。
from typing import List, Any
import numpy as np
import scipy.stats
import matplotlib.pyplot as plt

D = 50
BINS: List[float] = np.linspace(0, 1, D + 1).tolist()


def probability_mass(distribution: Any, x0: float, x1: float) -> float:
    """
    Computes the area under the distribution, wrapping at 1.
    The wrapping is done by adding the PDF at +- 1.
    """
    assert x1 > x0
    return (
        (distribution.cdf(x1) - distribution.cdf(x0))
        + (distribution.cdf(x1 + 1) - distribution.cdf(x0 + 1))
        + (distribution.cdf(x1 - 1) - distribution.cdf(x0 - 1))
    )


def point_density(x: float) -> List[float]:
    distribution: Any = scipy.stats.norm(loc=x, scale=0.05)
    density: List[float] = []
    for i in range(D):
        density.append(probability_mass(distribution, BINS[i], BINS[i + 1]))
    return density


def user_density(points: List[float]) -> Any:

    # Find the density of each point
    density: Any = np.array([point_density(p) for p in points])

    # Combine points and normalize
    combined = density.sum(axis=0)
    return combined / combined.sum()


if __name__ == "__main__":

    # Example for one user
    data: List[float] = [.05, .3, .5, .5]
    density = user_density(data)

    # Example for multiple users (N = 2)
    print([user_density(x) for x in [[.3, .5], [.7, .7, .7, .9]]])

    ### NB: THE REMAINING CODE IS FOR ILLUSTRATION ONLY!
    ### NB: THE IMPORTANT THING IS TO COMPUTE THE DENSITY FAST!
    middle: List[float] = []
    for i in range(D):
        middle.append((BINS[i] + BINS[i + 1]) / 2)
    plt.bar(x=middle, height=density, width=1.0 / D + 0.001)
    plt.xlim(0, 1)
    plt.xlabel("x")
    plt.ylabel("Density")
    plt.show()
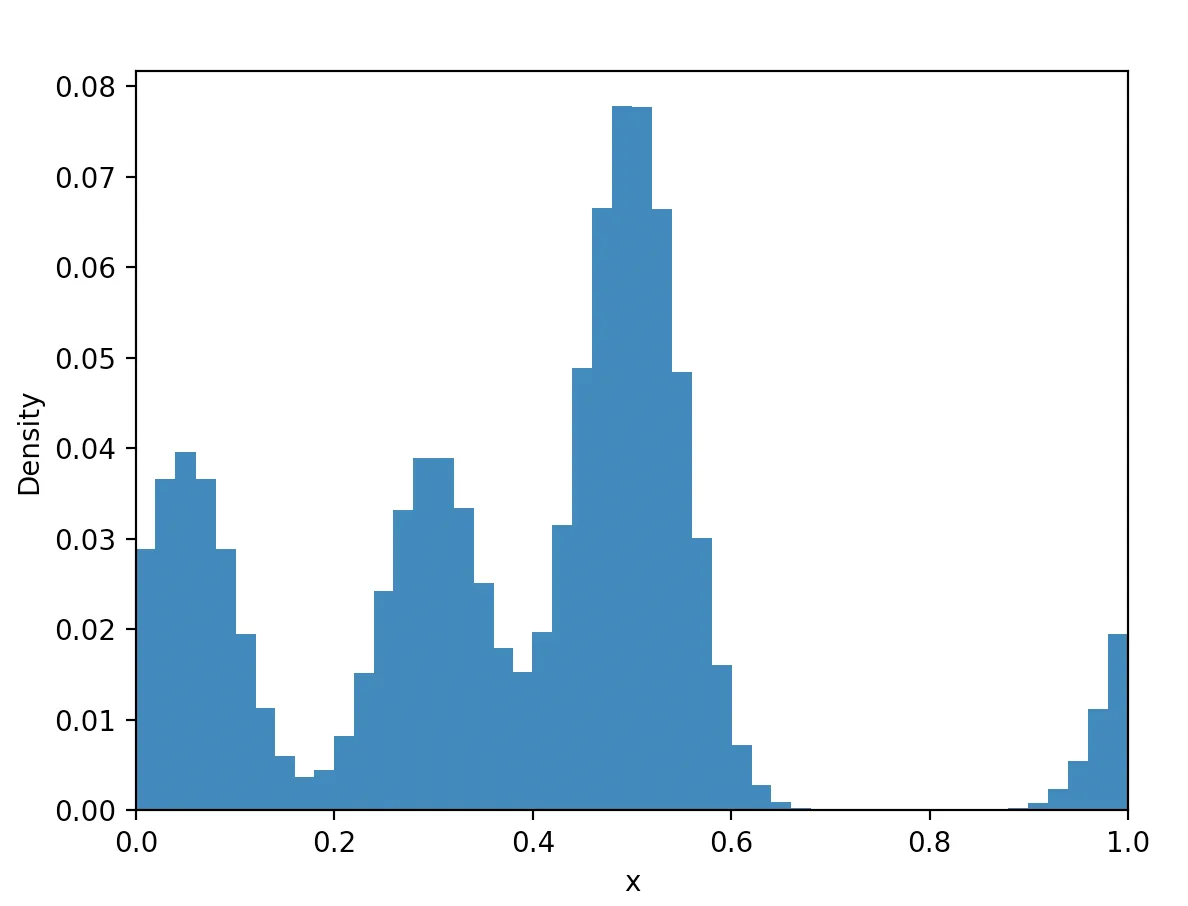
user_density()函数计算density。绘图只是为了说明方法。我们不关心图形本身:)
编辑3
请注意,P是每个用户的平均点数。某些用户可能会有更多或更少的点数。如果有帮助的话,您可以假设我们可以丢弃所有用户最多具有2 * P个点。在基准测试时忽略此部分也可以,只要解决方案能够处理灵活的用户点数即可。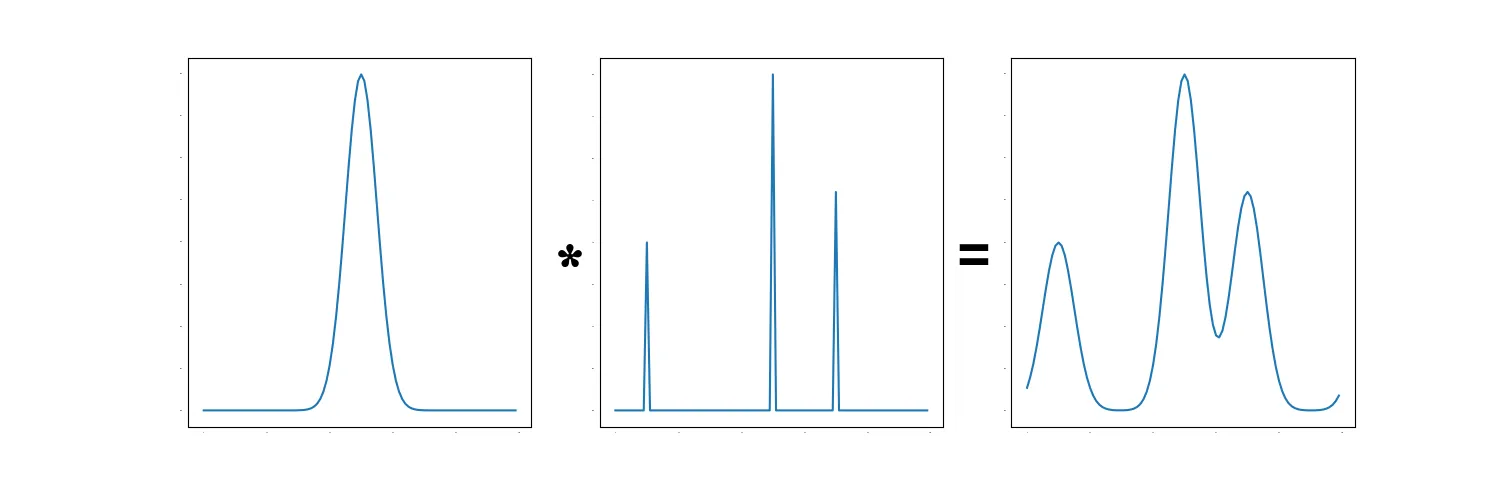
0.5处是双倍 - 它是0.08而其他的大约是0.04。 - pir1处的质量是有意为之的。请参见我的问题中的“我们需要将质量包裹在0和1周围,以便例如0.95处的点也会分配质量到0周围”的内容 :) - pirP.mean()约为 100? - tstanisl