Python中多类混淆矩阵

3

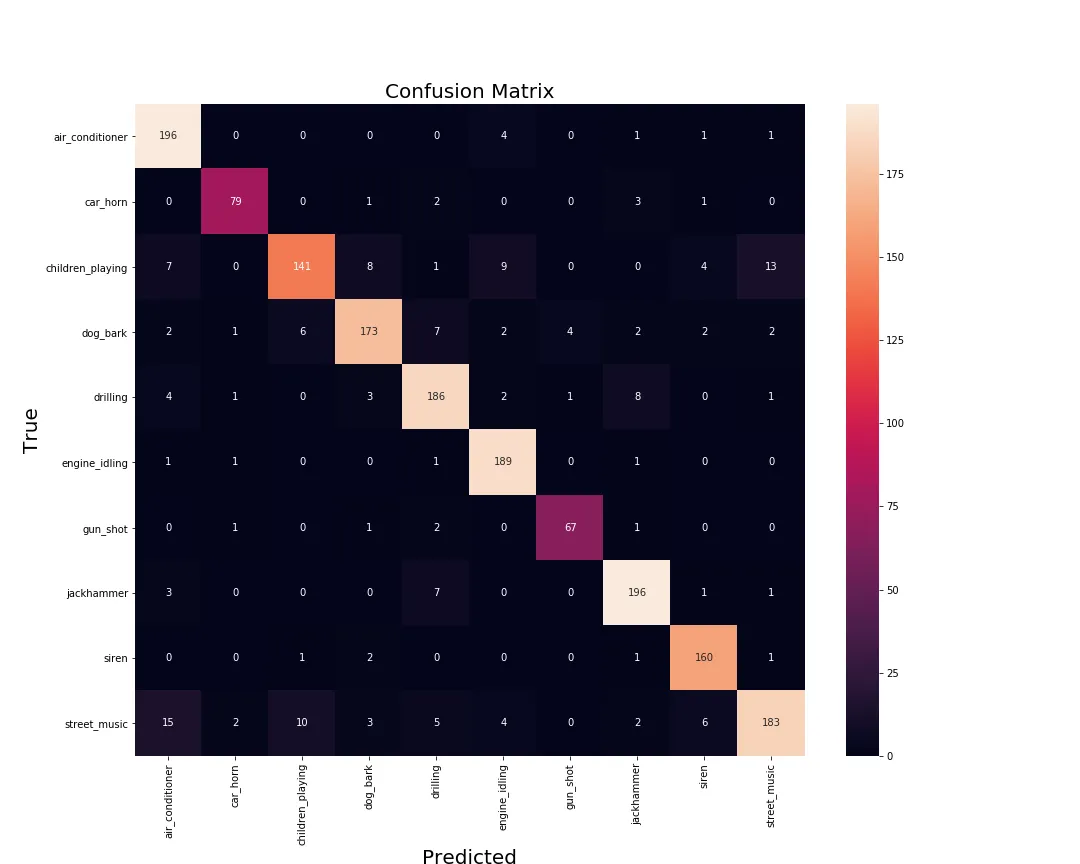
我已经通过Python代码生成了多分类混淆矩阵:

import seaborn as sns
import matplotlib.pyplot as plt

### Confusion Matrix
from sklearn.metrics import confusion_matrix
predictions = model.predict(x_test, steps=len(x_test), verbose=0)
#y_pred=model.predict(x_test)
#y_pred = np.round(y_pred)
y_pred = np.argmax(predictions, axis=-1)

y_true=np.argmax(y_test, axis=-1)

cm = confusion_matrix(y_true, y_pred)

## Get Class Labels
labels = le.classes_
class_names = labels

# Plot confusion matrix in a beautiful manner
fig = plt.figure(figsize=(16, 14))
ax= plt.subplot()
sns.heatmap(cm, annot=True, ax = ax, fmt = 'g'); #annot=True to annotate cells
# labels, title and ticks
ax.set_xlabel('Predicted', fontsize=20)
ax.xaxis.set_label_position('bottom')
plt.xticks(rotation=90)
ax.xaxis.set_ticklabels(class_names, fontsize = 10)
ax.xaxis.tick_bottom()

ax.set_ylabel('True', fontsize=20)
ax.yaxis.set_ticklabels(class_names, fontsize = 10)
plt.yticks(rotation=0)

plt.title('Refined Confusion Matrix', fontsize=20)

plt.savefig('ConMat24.png')
plt.show()

这段代码生成了这张图片:

enter image description here

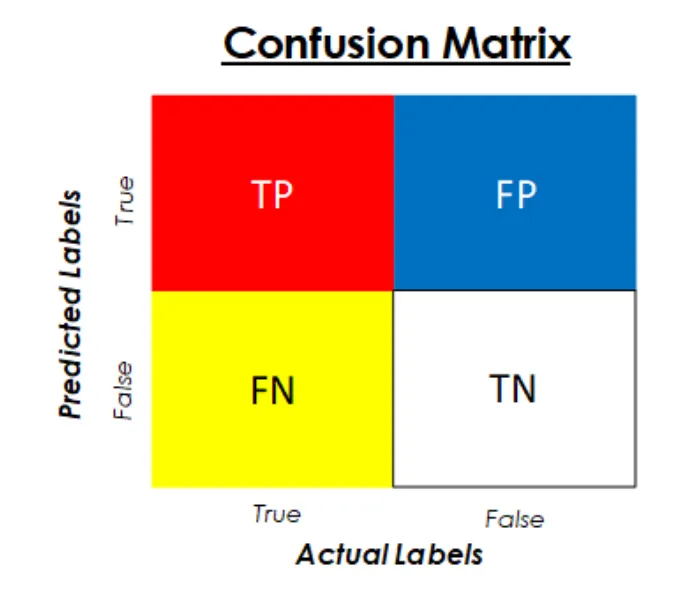
我如何获得仅包含4个单元格的简单混淆矩阵,就像这样:

enter image description here


2
如果你需要预测多个类别,那么如何定义真负? - Chris
1个回答

6
编写一个绘图函数:
import matplotlib.pyplot as plt

def plot_confusion_matrix(cm, classes,
                          normalize=False,
                          title='Confusion matrix',
                          cmap=plt.cm.Blues):

    plt.imshow(cm, interpolation='nearest', cmap=cmap)
    plt.title(title)
    plt.colorbar()
    tick_marks = np.arange(len(classes))
    plt.xticks(tick_marks, classes, rotation=45)
    plt.yticks(tick_marks, classes)

    if normalize:
        cm = cm.astype('float') / cm.sum(axis=1)[:, np.newaxis]
        print("Normalized confusion matrix")
    else:
        print('Confusion matrix, without normalization')

    thresh = cm.max() / 2.
    for i, j in itertools.product(range(cm.shape[0]), range(cm.shape[1])):
        plt.text(j, i, cm[i, j],
                 horizontalalignment="center",
                 color="white" if cm[i, j] > thresh else "black")

    plt.tight_layout()
    plt.ylabel('True label')
    plt.xlabel('Predicted label')

获取精度报告和混淆矩阵

from sklearn import metrics
import itertools

score = metrics.accuracy_score(y_test, y_pred)
print("accuracy:   %0.3f" % score)

cm = metrics.confusion_matrix(y_test, y_pred)
plot_confusion_matrix(cm, classes=['True', 'False'])

它将以你需要的相同格式绘制混淆矩阵。

感谢您的回复。我遇到了错误 ValueError: Classification metrics can't handle a mix of multilabel-indicator and multiclass targets - Joe

网页内容由stack overflow 提供, 点击上面的
可以查看英文原文,
原文链接