使用`scipy.interpolate.griddata`进行插值非常缓慢

10
我在尝试将“几乎”规则网格数据插值到地图坐标上,以便使用matplotlib.pyplot.imshow同时绘制地图和数据,但是scipy.interpolate.griddata的性能非常慢。由于matplotlib.pyplot.pcolormesh太慢,在处理alpha等问题时表现不佳。以下为最佳示例(可以从此处下载输入文件)。
import matplotlib.pyplot as plt
import numpy as np
from scipy.interpolate import griddata

map_extent = (34.4, 36.2, 30.6, 33.4)
# data corners:
lon = np.array([[34.5,        34.83806236],
                [35.74547079, 36.1173923]])
lat = np.array([[30.8,        33.29936152],
                [30.67890411, 33.17826563]])

# load saved files
topo = np.load('topo.npy')
lons = np.load('lons.npy')
lats = np.load('lats.npy')
data = np.load('data.npy')

# get max res of data
dlon = abs(np.array(np.gradient(lons))).max()
dlat = abs(np.array(np.gradient(lats))).max()

# interpolate the data to the extent of the map
loni,lati = np.meshgrid(np.arange(map_extent[0], map_extent[1]+dlon, dlon),
                        np.arange(map_extent[2], map_extent[3]+dlat, dlat))
zi = griddata((lons.flatten(),lats.flatten()),
              data.flatten(), (loni,lati), method='linear')
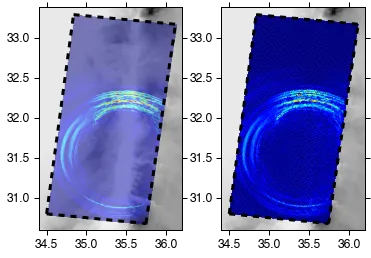
绘图:

fig, (ax1,ax2) = plt.subplots(1,2)
ax1.axis(map_extent)
ax1.imshow(topo,extent=extent,cmap='Greys')

ax2.axis(map_extent)
ax2.imshow(topo,extent=extent,cmap='Greys')

ax1.imshow(zi, vmax=0.1, extent=extent, alpha=0.5, origin='lower')
ax1.plot(lon[0],lat[0], '--k', lw=3, zorder=10)
ax1.plot(lon[-1],lat[-1], '--k', lw=3, zorder=10)
ax1.plot(lon.T[0],lat.T[0], '--k', lw=3, zorder=10)
ax1.plot(lon.T[-1],lat.T[-1], '--k', lw=3, zorder=10)


ax2.pcolormesh(lons,lats,data, alpha=0.5)
ax2.plot(lon[0],lat[0], '--k', lw=3, zorder=10)
ax2.plot(lon[-1],lat[-1], '--k', lw=3, zorder=10)
ax2.plot(lon.T[0],lat.T[0], '--k', lw=3, zorder=10)
ax2.plot(lon.T[-1],lat.T[-1], '--k', lw=3, zorder=10)
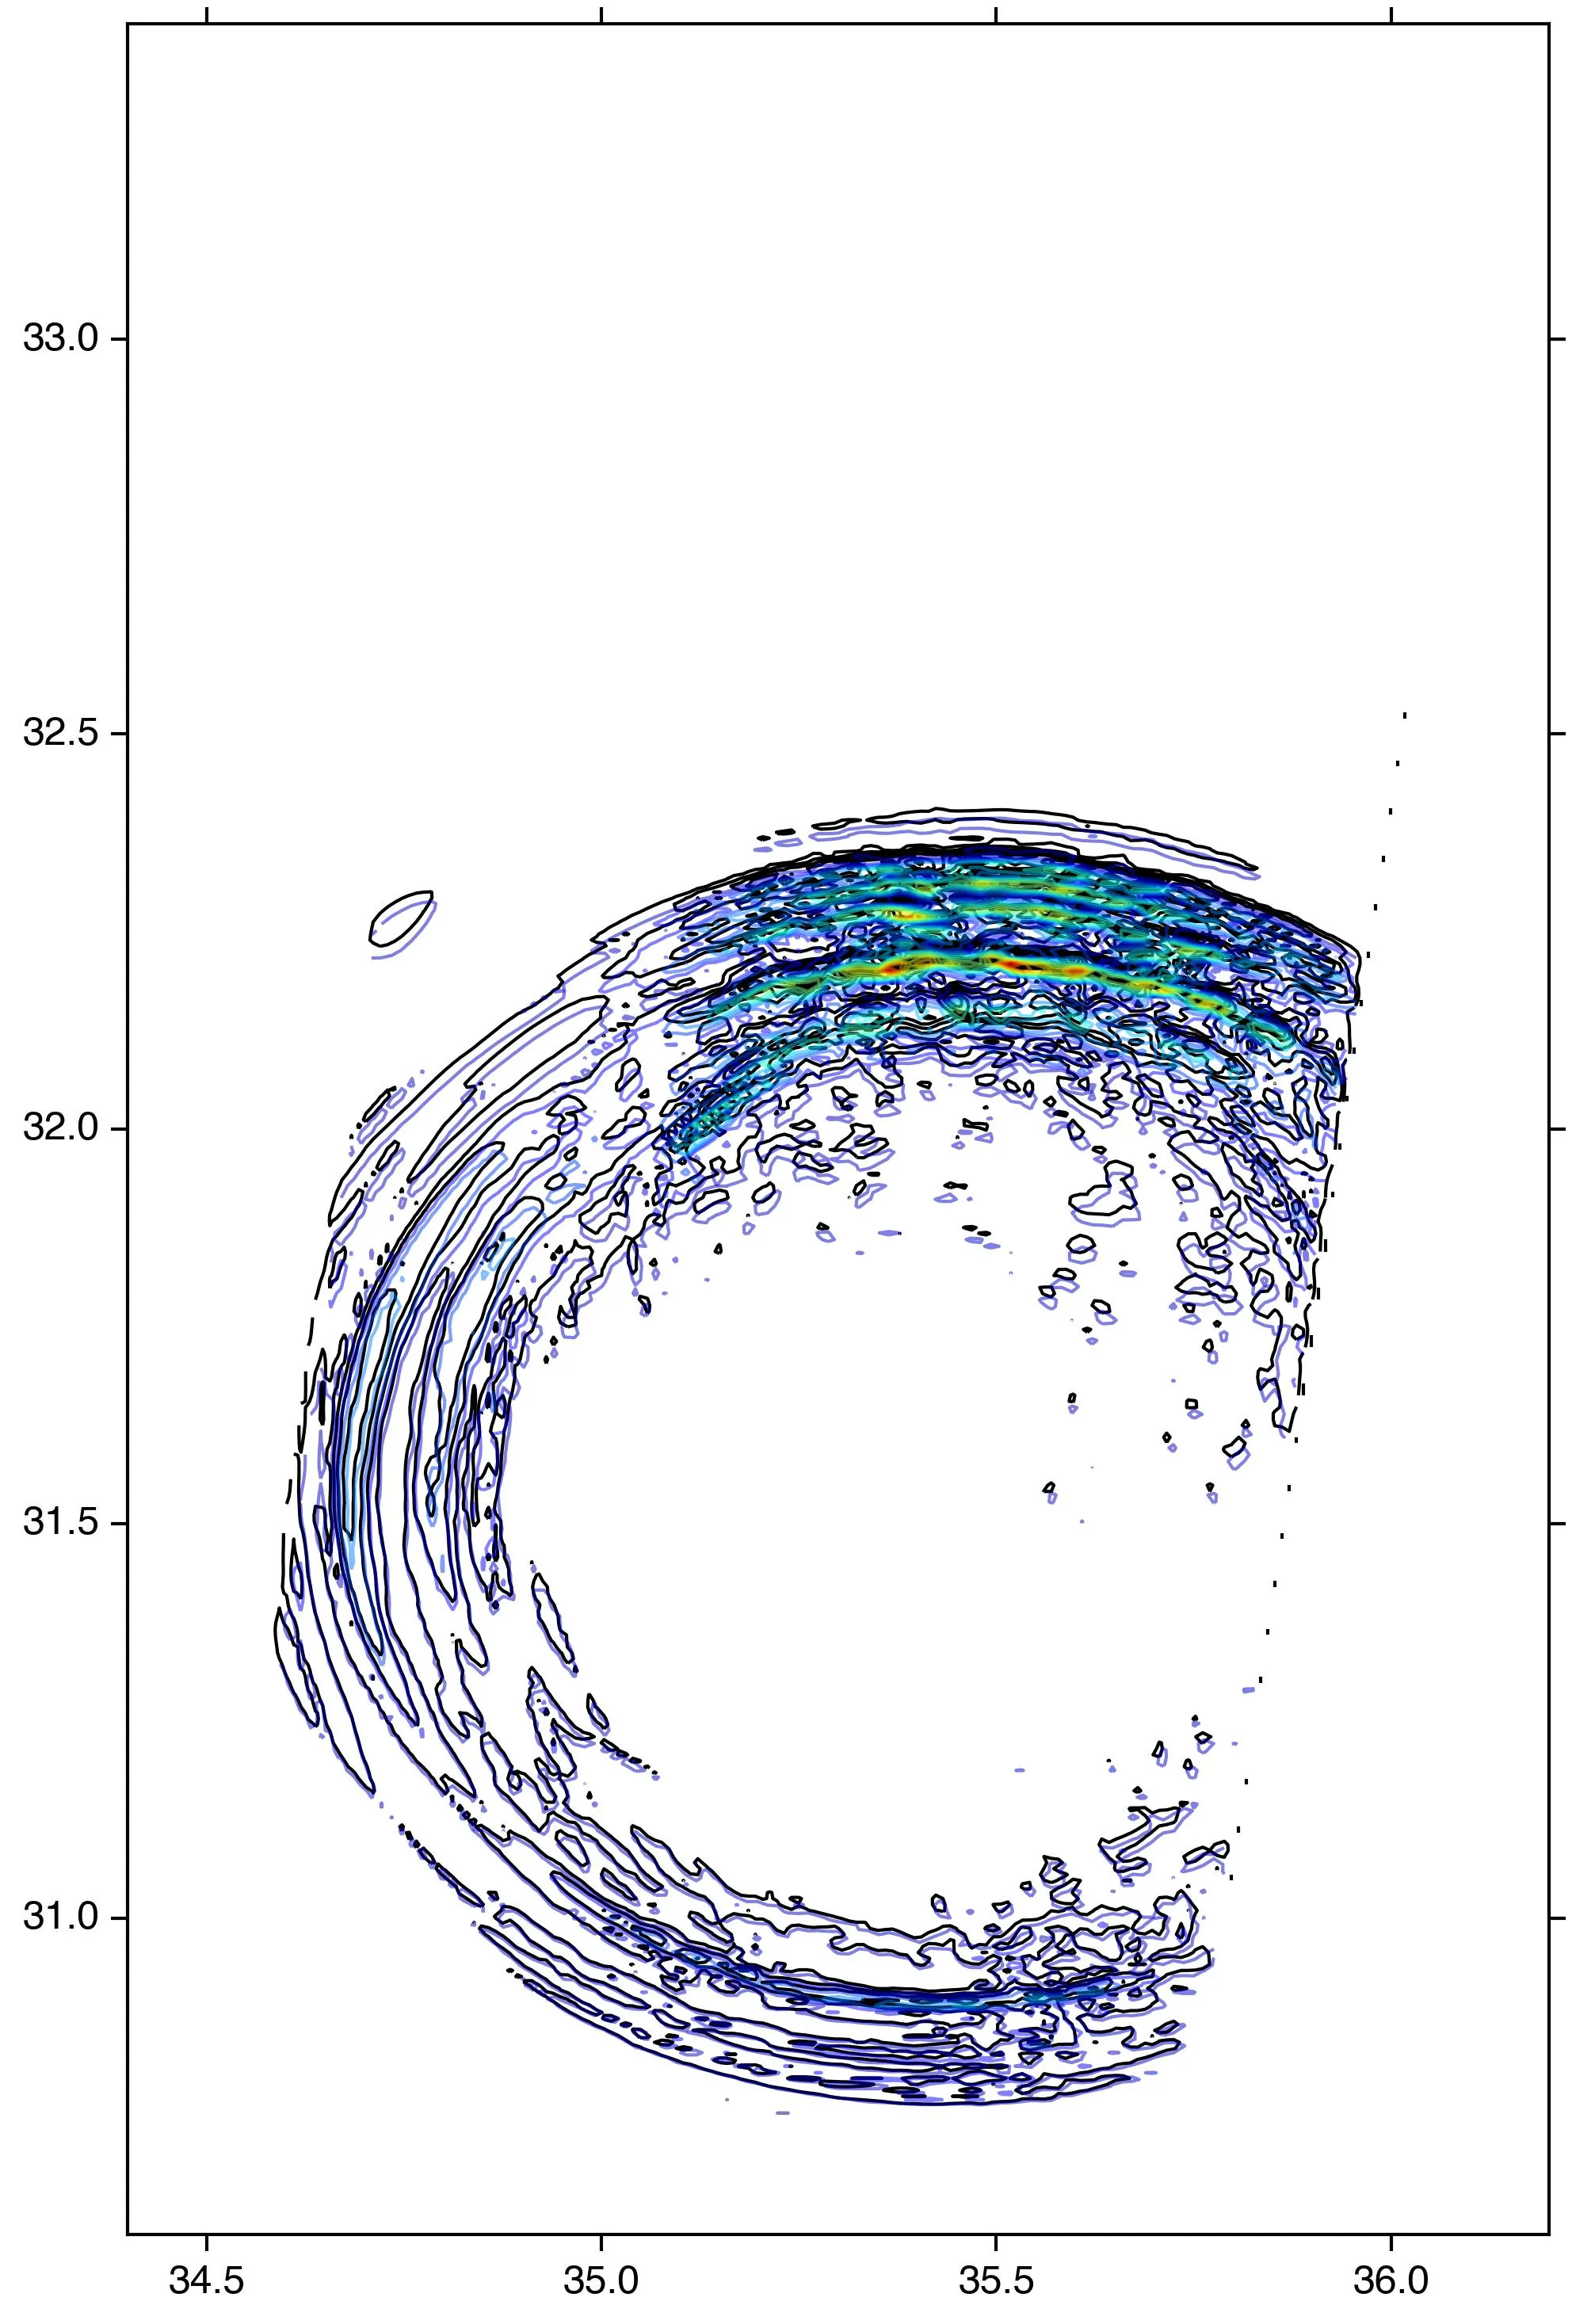
结果:

在此输入图片描述

注意,这不能简单地通过仿射变换旋转数据来完成。

使用我的真实数据,每次griddata调用需要超过80秒,而pcolormesh需要更长时间(超过2分钟!)。我已经查看了Jaimi的答案(链接)和Joe Kington的答案(链接),但我无法找到一种适合我的方法。

所有的数据集都有完全相同的lonslats,因此基本上我需要将它们映射到地图坐标并将相同的变换应用于数据本身。问题是如何做到这一点?

2个回答

7

经过长时间忍受scipy.interpolate.griddata极慢的性能后,我决定放弃griddata,转而使用OpenCV的图像变换。具体来说,是透视变换

因此,对于上面的例子,即上面问题中的例子,你可以在这里获取输入文件,下面是一段代码,它只需要1.1毫秒,而不是上面例子中需要的692毫秒的重新网格化部分。

import cv2
new_data = data.T[::-1]

# calculate the pixel coordinates of the
# computational domain corners in the data array
w,e,s,n = map_extent
dx = float(e-w)/new_data.shape[1]
dy = float(n-s)/new_data.shape[0]
x = (lon.ravel()-w)/dx
y = (n-lat.ravel())/dy

computational_domain_corners = np.float32(zip(x,y))

data_array_corners = np.float32([[0,new_data.shape[0]],
                                 [0,0],
                                 [new_data.shape[1],new_data.shape[0]],
                                 [new_data.shape[1],0]])

# Compute the transformation matrix which places
# the corners of the data array at the corners of
# the computational domain in data array pixel coordinates
tranformation_matrix = cv2.getPerspectiveTransform(data_array_corners,
                                                   computational_domain_corners)

# Make the transformation making the final array the same shape
# as the data array, cubic interpolate the data placing NaN's
# outside the new array geometry
mapped_data = cv2.warpPerspective(new_data,tranformation_matrix,
                                  (new_data.shape[1],new_data.shape[0]),
                                  flags=2,
                                  borderMode=0,
                                  borderValue=np.nan)

这种解决方案唯一的缺点是数据存在轻微偏移,如所附图像中未重叠的等高线所示。黑色表示重新网格化数据等高线(可能更准确),'jet' 色标表示 warpPerspective 数据等高线。
目前,我可以在性能上获得优势,因此对于这种差异我可以接受。希望这个解决方案也能帮助到其他人。
应该有人(不是我...)会找到改善 griddata 性能的方法 :) 享受吧!

enter image description here


2
我使用了numpy中的ndimage.map_coordinates。它效果很好!

http://docs.scipy.org/doc/scipy-0.14.0/reference/generated/scipy.ndimage.interpolation.map_coordinates.html

从上述链接中复制:
scipy.ndimage.interpolation.map_coordinates(input, coordinates, output=None, order=3, mode='constant', cval=0.0, prefilter=True)
通过插值将输入数组映射到新的坐标上。
坐标数组用于找到输出中每个点对应的输入坐标。在请求的阶数下,通过样条插值确定这些坐标处的输入值。
输出的形状由坐标数组的形状推导而来,删除第一个轴。第一个轴上的数组值是在输入数组中找到输出值的坐标。
    from scipy import ndimage
    a = np.arange(12.).reshape((4, 3))
    a
    array([[  0.,   1.,   2.],
            [  3.,   4.,   5.],
            [  6.,   7.,   8.],
            [  9.,  10.,  11.]])
    ndimage.map_coordinates(a, [[0.5, 2], [0.5, 1]], order=1)
    [ 2.  7.]

@user3197748,请问您能否尝试将您的答案应用到上面给出的示例中?您可以在此处下载文件:http://www.dropbox.com/s/m215o0ko304173d/input.zip - Shahar
抱歉,只有在阅读并尝试运行您的代码后,我才发现使用scipy.ndimage.interpolation.map_coordinates不太合适。但当我以极小的修改(extent=>map_extent)运行您的第一个版本代码(带有网格数据的那个版本)时,我发现代码可以立即运行。可能是因为我正在使用Anaconda numpy-mkl。 - ot226

网页内容由stack overflow 提供, 点击上面的
可以查看英文原文,
原文链接