我已经编写了以下绘图命令:
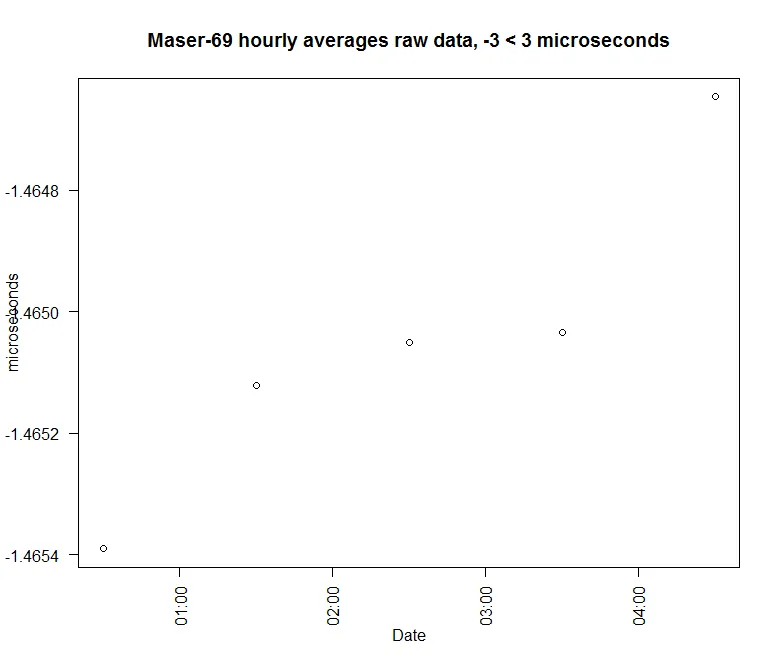
Stripped_DATA <- structure(list(Epoch = structure(c(1110925802, 1110929408, 1110933014,
1110936616, 1110940217),
class = c("POSIXct", "POSIXt"),
tzone = "Europe/Helsinki"),
Timediff = c(-1.4653909261659, -1.46512243581845,
-1.46505141447328, -1.46503418192427, -1.46464648029912)),
.Names = c("Epoch", "Timediff"),
row.names = c("11070", "21070", "31070", "41070", "51070"),
class = "data.frame")
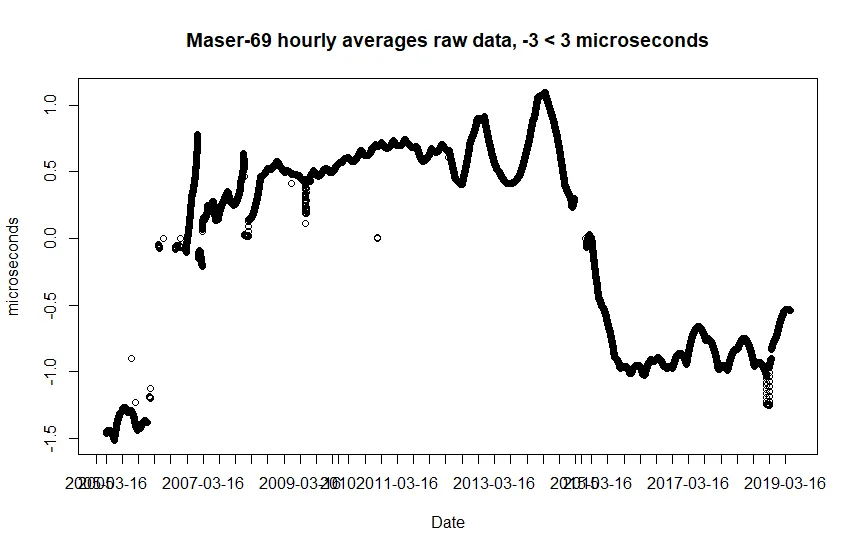
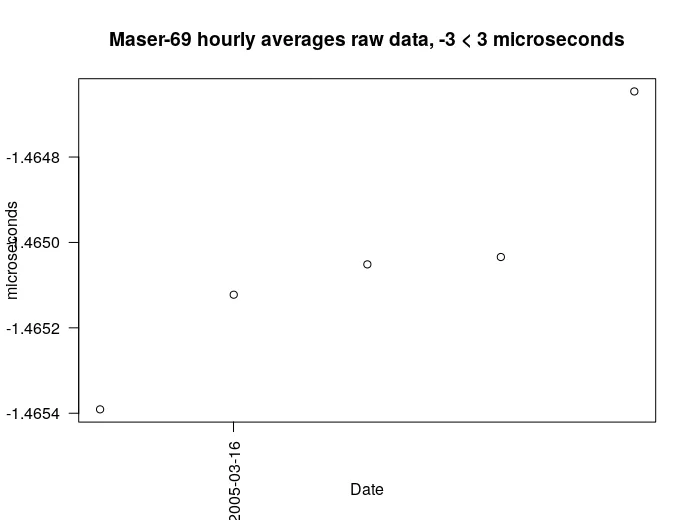
plot(Stripped_DATA, main = "Maser-69 hourly averages raw data, -3 < 3 microseconds", xlab = "Date", ylab = "microseconds")
ticks <- seq(as.POSIXct("2005-03-16 00:30:02", format = "%F %T"),
as.POSIXct("2019-04-19 14:29:55", format = "%F %T"), by = "4 months")
labels <- seq(as.Date("2005-03-16"), as.Date("2019-04-19"), by = "4 months")
axis.POSIXct(1, at = ticks, format = "%Y-%m-%d %H", labels = labels)
这将在图表中显示x轴。如何消除与日期重叠的三个年度刻度?此外,是否有一种方法可以将日期标签从水平变为垂直,以便我可以添加更多的日期标签?
dput(head(Stripped_DATA, 20))的结果来展示。 - AkselAlas=2或3来旋转标签。 - mischva11dput()的输出而不是在评论中添加来编辑您的问题。 - shea