在R中是否可以绘制图表?

20

我想知道在R中是否有任何包可以使用x、y坐标和形状大小来绘制类似于以下内容的图形:

enter image description here

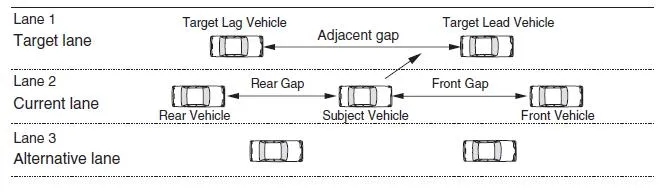
我有车辆前方中心点的坐标和它们的尺寸(长度和宽度)。

编辑

这是原始数据集的样子:

> head(df)
  Vehicle.ID Frame.ID Global.X Global.Y Vehicle.Length Vehicle.width Lane Preceding.Vehicle.ID Following.Vehicle.ID Spacing Headway
1          2       43  6451214  1873261           14.5           4.9    2                    0                   13       0       0
2          2       44  6451217  1873258           14.5           4.9    2                    0                   13       0       0
3          2       45  6451220  1873256           14.5           4.9    2                    0                   13       0       0
4          2       46  6451223  1873253           14.5           4.9    2                    0                   13       0       0
5          2       47  6451225  1873250           14.5           4.9    2                    0                   13       0       0
6          2       48  6451228  1873247           14.5           4.9    2                    0                   13       0       0
对于任意给定的帧,我想要可视化它们之间的差距,例如对于第500帧:
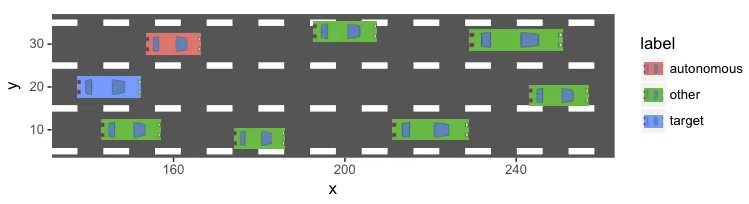
ff <- subset(df, Frame.ID==500)
qplot(x=Global.X, y=Global.Y, data=ff)

所有这些点都是车辆的前部中心坐标。我不知道如何显示每个车辆的长度和宽度,并标记间隙值。


6
我确信你可能行得通,但我强烈推荐在这项工作中使用另一个工具。如果你想要编程,我的选择会是tikZ;如果你只需要少量图表,则使用一些所见即所得的绘图程序。 - Gregor Thomas
我有数千辆车,每辆车的运动(以改变坐标的方式)都记录了数个时间段。我想能够在任何时刻绘制这种类型的图表(即在任何给定的框架)。从上面看车的视图并不重要,用长度和宽度绘制简单的矩形即可。 - umair durrani
5
尽管这个任务可能会引起人们的兴趣(这是我唯一能想象出任何人会点赞的方式,更不用说6个人了),但在当前形式下,它不适合作为SO的问题。在这里询问包/库建议通常是离题的,而且您还没有提供任何具体的示例数据供人们使用。如果您有一个具体的尝试,带有一些实际数据,并希望得到反馈,那就好办了。否则,这个问题应该被关闭。 - joran
听起来 rect() 函数可能会满足你的所有需求... - Ben Bolker
@joran 我现在已经包含了我尝试过的内容。 - umair durrani
显示剩余5条评论
1个回答

76

因此,我不建议您依赖ggplot来解决此问题,因为其他建议的解决方案很可能更好,但是由于我一直想深入了解ggplot,所以这个问题引起了我的兴趣。这是我想到的解决方法:

ggplot(df, aes(x=x, y=y, length=length, width=width, fill=label)) +
  geom_hline(yintercept=seq(5, 35, by=10), color="white", size=2, linetype=2) +
  geom_car() +
  coord_equal() +
  theme(panel.background = element_rect(fill="#555555"), 
    panel.grid.major = element_blank(),
    panel.grid.minor = element_blank())

进入图片描述

您还可以使用geom_segment添加箭头或使用geom_text添加显式标签,但我们将其作为读者的练习。

现在,为了使其工作,我们必须创建geom_car,但如果您不需要详细的图片,您可以使用geom_rect。这是geom_car(注意:现在也作为ggbg包的一部分提供):

# Generate a car 'grob' using a baseline PNG

car.raster <- png::readPNG("~/Downloads/car2.png")

# The `grid` grob actually responsible for rendering our car, 
# combines our transparent car elements with a background rectangle
# for color/fill.

carGrob <- function(x, y, length, width, gp) {
  grid::grobTree(
    grid::rectGrob(
      x, y, hjust=.5, height=width, width=length,
      gp = gp
    ),
    grid::rasterGrob(
      car.raster, x=x, y=y, hjust=.5, height=width, width=length
) ) }
# The `ggproto` object that maps our data to the `grid` grobs

GeomCar <- ggplot2::ggproto("GeomCar", ggplot2::Geom,
  # Generate grobs from the data, we have to reconvert length/width so
  # that the transformations persist

  draw_panel=function(self, data, panel_params, coords) {
    with(
      coords$transform(data, panel_params),
      carGrob(
        x, y, length=xmax-xmin, width=ymax-ymin,
        gp=grid::gpar(
          col = colour, fill = alpha(fill, alpha),
          lwd = size * .pt, lty = linetype, lineend = "butt"
  ) ) ) },
  # Convert data to coordinates that will get transformed (length/width don't
  # normally).

  setup_data=function(self, data, params) {
    transform(data,
      xmin = x - length / 2, xmax = x + length / 2,
      ymin = y - width / 2, ymax = y + width / 2
  ) },
  # Required and default aesthetics

  required_aes=c("x", "y", "length", "width"),
  default_aes = aes(
    colour = NA, fill = "grey35", size = 0.5, linetype = 1, alpha = NA
  ),
  # Use the car grob in the legend

  draw_key = function(data, params, size) {
    with(
      data,
      carGrob(
        0.5, 0.5, length=.75, width=.5,
        gp = grid::gpar(
          col = colour, fill = alpha(fill, alpha),
          lwd = size * .pt, lty = linetype, lineend = "butt"
  ) ) ) }
)
# External interface

geom_car <- function(
  mapping=NULL, data=NULL, ..., inherit.aes=TRUE, show.legend=NA
) {
  layer(
    data=data, mapping=mapping, geom=GeomCar, position="identity",
    stat="identity", show.legend = show.legend, inherit.aes = inherit.aes,
    params=list(...)
  )
}

汽车:

enter image description here

数据:

df <- read.table(h=T, t="vehicle  x y   length  width   label
1   150 10  14  5   other
2   180 8   12  5   other
3   220 10  18  5   other
4   145 20  15  5   target
5   250 18  14  5   other
6   160 30  13  5   autonomous
7   200 33  15  5   other
8   240 31  22  5   other
")

1
@BrodieG Hadley问道他是否可以在Twitter上的下一本ggplot2书中分享这个。https://twitter.com/hadleywickham/status/609456138472394752 - Tyler Rinker
1
@TylerRinker,感谢你的提醒;否则我可能要等很久才能注意到。 - BrodieG
这很棒,但需要更多的青蛙。 :) - jbaums
2
几乎可以确定这是Ggplot2/prooto变更的问题。很多东西都发生了改变,特别是如何进行扩展。恐怕我没有时间专注于此,但也许你可以再以“如何在新版本的Ggplot2中复制这个答案”为形式提出这个问题,然后有人会愿意尝试解决它。 - BrodieG
2
@umairdurrani现在应该可以使用新版本的ggplot2。 - BrodieG
显示剩余2条评论

网页内容由stack overflow 提供, 点击上面的
可以查看英文原文,
原文链接