R ggpubr:将图例标题移动到图例键上方

3

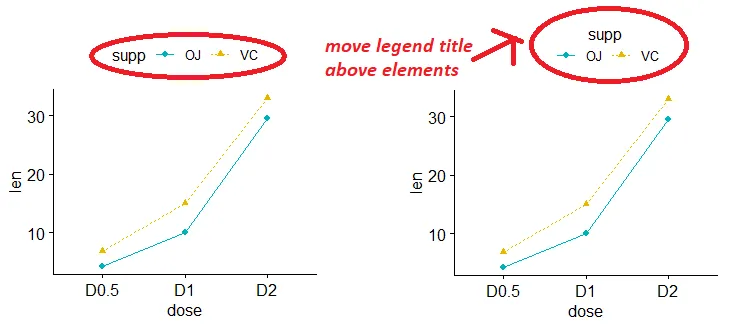
我在使用ggpubr时遇到了图例位置的问题。我知道可以通过 ggpar(legend = "bottom") 来修改图例位置。但是如何将图例标题放置在图例键上方?

ggplot2 中,似乎可以通过 guide_legend(title.position = "top") 实现,但如何在 ggpubr 中实现呢?(感谢 @c06n 和链接: https://ggplot2.tidyverse.org/reference/guide_legend.html)。我想要结合 ggplot2ggpubr,但不确定怎么做。

enter image description here

示例:

df2 <- data.frame(supp=rep(c("VC", "OJ"), each=3),
                  dose=rep(c("D0.5", "D1", "D2"),2),
                  len=c(6.8, 15, 33, 4.2, 10, 29.5))

# Plot "len" by "dose" and
# Change line types and point shapes by a second groups: "supp"
p<- ggline(df2, "dose", "len",
       linetype = "supp", shape = "supp",
       color = "supp", palette = c("#00AFBB", "#E7B800"))

# Seems not working
ggpar(p,
  linetype = guide_legend(title = "My title", title.position = "top"))
可能是ggplot图例:键位相对于标签的位置的重复问题。 - markus
可能是这样。但对我来说有点不同。有一个技巧,因为guides(colour = guide_legend(title.position = "top"))可以工作,但例如guides(shape = guide_legend(title.position = "top"))就不行。 - Bruno Pinheiro
2个回答

4
我不知道ggpubr是什么,它似乎是ggplot2的一个包装器。如果这是真的,和/或者它已经实现了与ggplot2相同的功能,你应该能够通过图例指南实现,参见这里。我认为你需要调整的是title.position
如果你不能用ggpubr实现这一点,我建议使用ggplot2,也许调整主题以满足你的需求。
编辑。@markus有答案,所以把它都放在一个地方:
p <- ggline(df2, "dose", "len",
           linetype = "supp", 
           shape = "supp",
           color = "supp", 
           palette = c("#00AFBB", "#E7B800")) +
  guides(color = guide_legend(title.position = "top", 
                              title.hjust = 0.5))

有趣的问题来自@Bruno Pinheiro,他想知道为什么只有 color (和 fill)可以使用,而 shapelinetype 不能。如果图需要是单色的话,这将是相关的。所有三个应该同样作为分组因素工作。

有人有想法吗?


谢谢@c06n,但你的方法不起作用。我已经更新了我的问题,并开始在ggplot2中重新制作东西。 - maycca
1
你的建议是正确的 @c06n,代码是 p + guides(color = guide_legend(title.position = "top", title.hjust = 0.5)) - markus
太棒了@markus,谢谢你,你的建议很有效!请问你能把它发表为一个答案吗? - maycca
1
@maycca 很高兴它起作用了。我认为 @c06n 应该在他的答案中包含指向正确方向的代码。顺便说一下,它能够工作是因为 ggpubr 返回一个 ggplot 对象,你可以按照通常的方式进行修改。 - markus
抱歉各位。我在这里进行一些测试,但是当我发布答案后,发现有新的评论。我会保留它,直到@c06n编辑他的答案,然后再删除它。 - Bruno Pinheiro

1
这些选项在这里有效。

使用ggpubr

df2 <- data.frame(supp=rep(c("VC", "OJ"), each=3),
                  dose=rep(c("D0.5", "D1", "D2"),2),
                  len=c(6.8, 15, 33, 4.2, 10, 29.5))

library(ggpubr)
p <- ggline(df2, "dose", "len",
       linetype = "supp", shape = "supp",
       color = "supp", palette = c("#00AFBB", "#E7B800"))

p + guides(colour = guide_legend(title.position = "top"))

我不知道为什么,但如果我为另一个美学设置指南,则传说标题位置不会改变:
p + guides(shape = guide_legend(title.position = "top"))
p + guides(linetype = guide_legend(title.position = "top"))

对于 ggplot2 专家来说,这是一个很好的问题。

以下是在 ggplot2 中实现相同效果的代码:

library(ggplot2)
ggplot(df2, aes(x = dose, y = len, colour = supp)) +
  geom_line(aes(group = supp, linetype = supp)) +
  geom_point(aes(shape = supp)) +
  scale_colour_manual(values = c("#00AFBB", "#E7B800")) +
  theme_classic() +
  theme(legend.position = "top") +
  guides(colour = guide_legend(title.position = "top"))

网页内容由stack overflow 提供, 点击上面的
可以查看英文原文,
原文链接