我该如何移除栅格图例周围的黑色框?更一般地,我在哪里可以找到有关R栅格图例选项的文档?
require(raster)
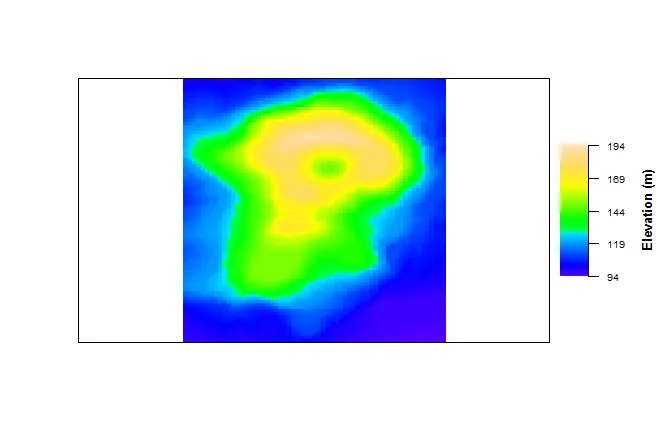
data(volcano)
r <- raster(volcano)
plot(r, col=topo.colors(100), legend=FALSE, axes=FALSE)
r.range <- c(minValue(r), maxValue(r))
plot(r, legend.only=TRUE, col=topo.colors(100),
legend.width = 2,
axis.args=list(at=seq(r.range[1], r.range[2], 25),
labels=seq(r.range[1], r.range[2], 25),
cex.axis=0.6),
legend.args=list(text='Elevation (m)', side=4, font=2, line=2.5, cex=0.8))
plot()文档只描述它们自己的部分,所以对于通用的绘图选项(不特定于光栅),您需要查看通用的plot()文档(?plot然后选择基本R)。 - undefined