D3饼图中的文本旋转

4

我有一个小的D3脚本:

<script>
    d3.csv("../data/school_attendance.csv", function(data) {
        // Use d3.pie() to create and configure the data that we need in a format that we can enter into.
        let arc_data = d3.pie().value(d => d['YTD Enrollment(Avg)']).padAngle(d => 0.0115)(data);

        // Create the arc factory function that will render each data segment.
        let arc = d3.arc().innerRadius(75).outerRadius(160);

        // Run through each element of arc_data, creating and appening the arc for each one.
        d3.select("svg")
            .append("g")
            .attr("id", "transform")
            .attr("transform", "translate(400, 200)")
            .selectAll('path')
            .data(arc_data)
            .enter()
            .append('path')
            .attr('d', arc)
            .attr('fill', 'steelblue');

        // Use arc and arc_data to calculate centroids, and from there to calculate.
        arc_data.forEach(function(d, i) {
            [x, y] = arc.centroid(d);
            let label = d.data['District']
            // let rotation = d['startAngle'] * 180 / Math.PI;
            let rotation = d['startAngle'] / Math.PI / 2
            d3.select("#transform").append("text")
                .attr("x", x).attr("y", y)
                .attr("text-anchor", "middle").attr("alignment-baseline", "middle")
                .attr("transform", "rotate(" + rotation + ")")
                .text(label);
        })
    })
</script>

这将产生以下输出: enter image description here 
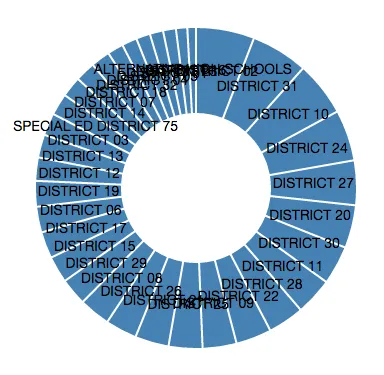
我想将文本标签旋转,以便它们出现在每个弧段的中间。
然而,对我来说显而易见的答案是:
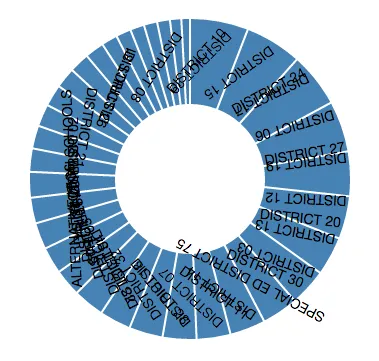
let rotation = d['startAngle'] / Math.PI / 2 * 360 - 90;

预期效果未出现:

enter image description here

我在这里犯了什么错误,应该怎么修复?


这里有更多的上下文链接 - Aleksey Bilogur
让rotation等于(d.startAngle + d.endAngle) * 90 / Math.PI - 90;如果rotation大于90,那么rotation就等于rotation减去180。为什么需要这个三元运算符呢?我看到在其他类似问题的回答中有这样的用法,但是对这部分我理解最少。 - Aleksey Bilogur
三元运算是必要的,以使所有文本从左到右。我在我的答案中创建了一个演示。只保留三元运算的真实部分,你就会明白我的意思。 - Gerardo Furtado
1个回答

8

我认为这里的一个问题是使用attr来设置标签的xy位置。相反,应该进行翻译:

.attr("transform", "translate(" + [x,y] + ")");

之后,就是数学部分:
var rotation = (d.startAngle/2 + d.endAngle/2) * 180/Math.PI;

但是上述变量存在一个问题,即将所有从甜甜圈中心到边界的文本定位,一些标签(在甜甜圈左侧)最终倒置,从右到左。由于我们从左到右阅读,我认为这个三元组更加优雅:

var rotation = d.endAngle < Math.PI ? 
    (d.startAngle/2 + d.endAngle/2) * 180/Math.PI : 
    (d.startAngle/2  + d.endAngle/2 + Math.PI) * 180/Math.PI ;

这里有一个演示:

const width = 400
const height = 400;
const radius = Math.min(width, height) / 2.5;

const totals = [{
    "name": "District A",
    "value": 20
}, {
    "name": "District B",
    "value": 50
}, {
    "name": "District C",
    "value": 30
}, {
    "name": "District D",
    "value": 20
}, {
    "name": "District E",
    "value": 50
}, {
    "name": "District F",
    "value": 30
}];

const color = d3.scaleOrdinal()
    .range(['#869099', '#8c7853', '#007d4a']);

const arc = d3.arc()
    .outerRadius(radius - 10)
    .innerRadius(40);

const pie = d3.pie()
    .sort(null)
    .value((d) => {
        return d.value
    });

const svg = d3.select('body').append('svg')
    .attr('width', width)
    .attr('height', height)
    .append('g')
    .attr('transform', 'translate(' + width / 2 + ',' + height / 2 + ')');

const g = svg.selectAll('.arc')
    .data(pie(totals))
    .enter()
    .append('g')
    .attr('class', 'arc');

g.append('path')
    .attr('d', arc)
    .style('fill', 'steelblue')
    .style('stroke', 'white');

pie(totals).forEach(function(d, i) {
    [x, y] = arc.centroid(d);
    let label = d.data.name;
    var rotation = d.endAngle < Math.PI ? (d.startAngle / 2 + d.endAngle / 2) * 180 / Math.PI : (d.startAngle / 2 + d.endAngle / 2 + Math.PI) * 180 / Math.PI;
    svg.append("text")
        .attr("text-anchor", "middle").attr("alignment-baseline", "middle")
        .attr("transform", "translate(" + [x, y] + ") rotate(-90) rotate(" + rotation + ")")
        .text(label);
})
<script src="https://d3js.org/d3.v4.min.js"></script>


1
谢谢。这一系列的文章很好地描述了这里正在发生的事情。 - Aleksey Bilogur

网页内容由stack overflow 提供, 点击上面的
可以查看英文原文,
原文链接