我正在使用以下代码
d3 = vals;
n = datesmonth;
figure
plot(n,d3);
colormap(jet(12));
hold on
plot(n, d3,'b-');
scatter(n, d3, [], RiskierInd, 'filled');
caxis([1 12]);
colorbar('YTick',[1:12],...
         'YTickLabels',{'Non-Durables','Durables','Manufacturing','Oil, Gas and Coal ','Chemicals','Technology','Telephone & TV','Utilities','Wholesale and Retail','Health','Finance','Other'})
datetick('x','mm-yyyy')
要生成这个图形
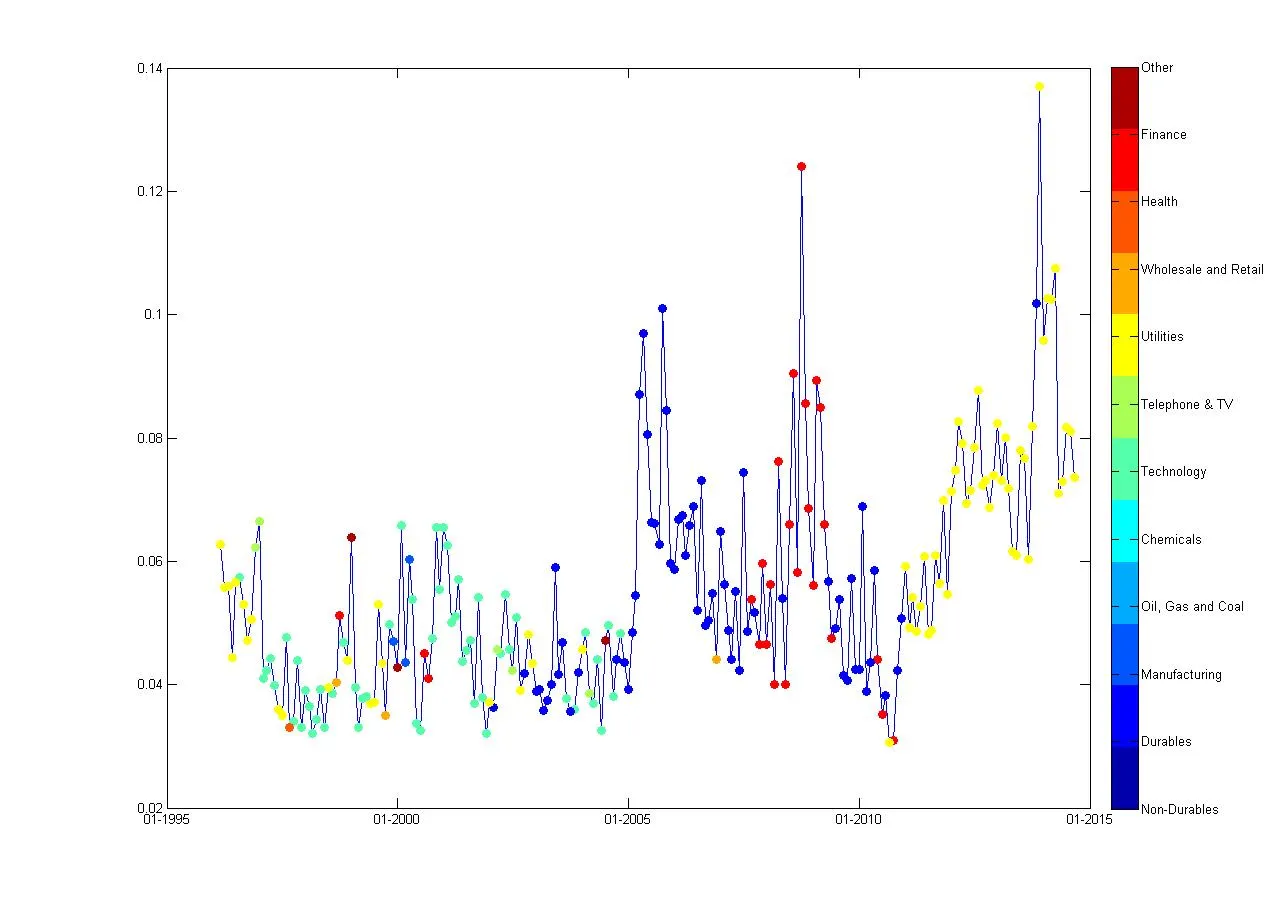
我有两个快速问题:
是否可以将每种颜色的颜色条字符串条目居中?例如,条目“非耐用品”不应位于颜色条的底部,而应位于最深蓝色类别的中间。
是否可以手动选择每个类别的颜色?