如上所述,我想放大使用
代码:
plotyy创建的图表。
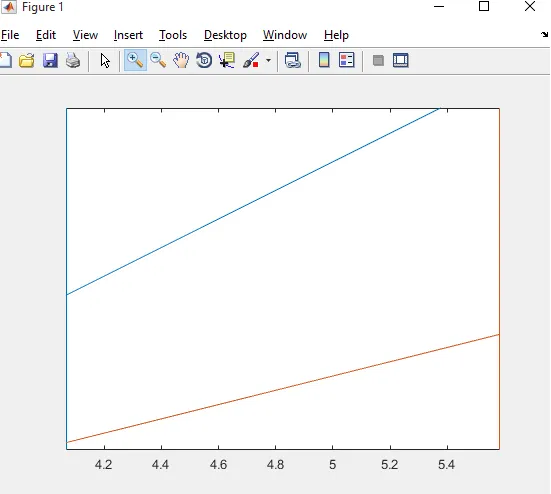
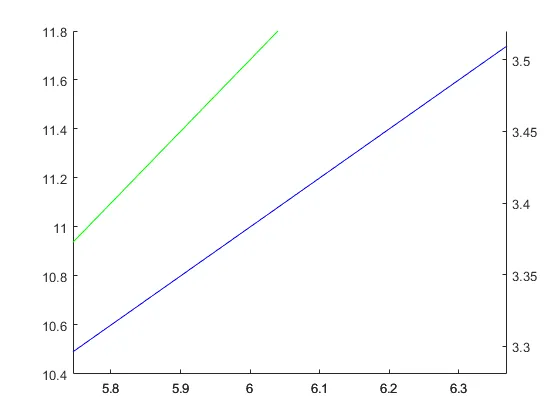
当我这样做时,yTicks不会更新为可见的新限制。
因此,如果你缩放太多,可能就看不到任何yTicks了。
我找到了ActionPostCallback函数,但是我无法使其工作,而xTicks则正常。代码:
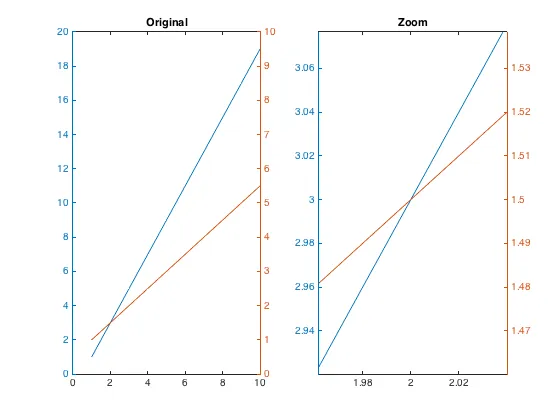
figure, plotyy(1:10,1:2:20,1:10,1:0.5:5.5)
结果如下: