用Python绘制切线两条线段的弧形

4
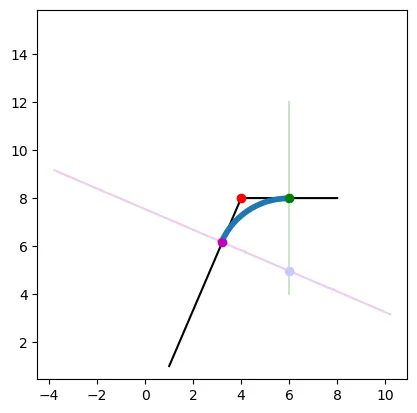
我正在尝试在两个点之间绘制一个由n步组成的弧,以便我可以将2D形状倒角。这张图片展示了我的想法(蓝色的弧线)和我尝试实现它的方法:
  1. 根据半径从目标点(红点)移动
  2. 获取这些线的法线
  3. 获取法线的交点以找到圆的中心
  4. 从圆心处绘制弧线

Beveled Edge

这是我目前的进展:

Matplotlib

如您所见,圆并不与线段相切。我认为我的方法可能存在缺陷,因为我认为用于法线的两个点应该移动圆的半径。请问有人能告诉我我错在哪里以及我如何能够找到这些点的弧吗?以下是我的代码:
import matplotlib.pyplot as plt
import numpy as np

#https://stackoverflow.com/questions/51223685/create-circle-tangent-to-two-lines-with-radius-r-geometry

def travel(dx, x1, y1, x2, y2):
    a = {"x": x2 - x1, "y": y2 - y1}
    mag = np.sqrt(a["x"]*a["x"] + a["y"]*a["y"])
    
    if (mag == 0):
        a["x"] = a["y"] = 0;
    else:
        a["x"] = a["x"]/mag*dx
        a["y"] = a["y"]/mag*dx

    return [x1 + a["x"], y1 + a["y"]]

def plot_line(line,color="go-",label=""):
    plt.plot([p[0] for p in line],
             [p[1] for p in line],color,label=label)

def line_intersection(line1, line2):
    xdiff = (line1[0][0] - line1[1][0], line2[0][0] - line2[1][0])
    ydiff = (line1[0][1] - line1[1][1], line2[0][1] - line2[1][1])

    def det(a, b):
        return a[0] * b[1] - a[1] * b[0]

    div = det(xdiff, ydiff)
    if div == 0:
       raise Exception('lines do not intersect')

    d = (det(*line1), det(*line2))
    x = det(d, xdiff) / div
    y = det(d, ydiff) / div
    return x, y
    
line_segment1 = [[1,1],[4,8]]
line_segment2 = [[4,8],[8,8]]
line = line_segment1 + line_segment2
plot_line(line,'k-')
radius = 2

l1_x1 = line_segment1[0][0]
l1_y1 = line_segment1[0][1]
l1_x2 = line_segment1[1][0]
l1_y2 = line_segment1[1][1]
new_point1 = travel(radius, l1_x2, l1_y2, l1_x1, l1_y1)

l2_x1 = line_segment2[0][0]
l2_y1 = line_segment2[0][1]
l2_x2 = line_segment2[1][0]
l2_y2 = line_segment2[1][1]
new_point2 = travel(radius, l2_x1, l2_y1, l2_x2, l2_y2)

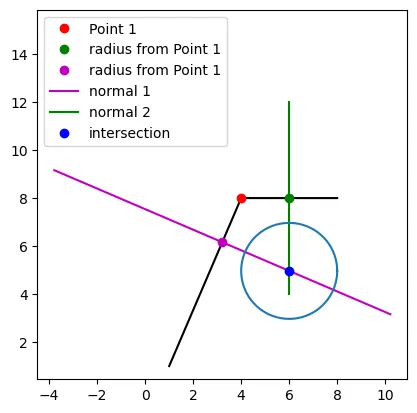
plt.plot(line_segment1[1][0], line_segment1[1][1],'ro',label="Point 1")
plt.plot(new_point2[0], new_point2[1],'go',label="radius from Point 1")
plt.plot(new_point1[0], new_point1[1],'mo',label="radius from Point 1")

# normal 1
dx = l1_x2 - l1_x1
dy = l1_y2 - l1_y1
normal_line1 = [[new_point1[0]+-dy, new_point1[1]+dx],[new_point1[0]+dy, new_point1[1]+-dx]]
plot_line(normal_line1,'m',label="normal 1")

# normal 2
dx2 = l2_x2 - l2_x1
dy2 = l2_y2 - l2_y1
normal_line2 = [[new_point2[0]+-dy2, new_point2[1]+dx2],[new_point2[0]+dy2, new_point2[1]+-dx2]]
plot_line(normal_line2,'g',label="normal 2")

x, y = line_intersection(normal_line1,normal_line2)
plt.plot(x, y,'bo',label="intersection") #'blue'

theta = np.linspace( 0 , 2 * np.pi , 150 )
a = x + radius * np.cos( theta )
b = y + radius * np.sin( theta )
plt.plot(a, b)
plt.legend()
plt.axis('square')
plt.show()

非常感谢!

我直觉地认为这只适用于距离点相等的目标。我错了吗? - Salvatore Daniele Bianco
@SalvatoreDanieleBianco 您好!感谢您的留言。如果我理解正确,弧所需的两个点与红点距离相同(半径值为2),是吗? - Dr. Pontchartrain
是的,完全正确。我提出这个问题是因为在你的问题中没有明确指定。我只是想确保你知道这一点。 - Salvatore Daniele Bianco
3个回答

1

你可以尝试制作贝塞尔曲线,就像这个示例。一个基本的实现可能是:

import matplotlib.path as mpath
import matplotlib.patches as mpatches
import matplotlib.pyplot as plt

Path = mpath.Path

fig, ax = plt.subplots()

# roughly equivalent of your purple, red and green points 
points = [(3, 6.146), (4, 8), (6, 8.25)]

pp1 = mpatches.PathPatch(
    Path(points, [Path.MOVETO, Path.CURVE3, Path.CURVE3]),
    fc="none",
    transform=ax.transData
)

ax.add_patch(pp1)

# lines between points
ax.plot([points[0][0], points[1][0]], [points[0][1], points[1][1]], 'b')
ax.plot([points[1][0], points[2][0]], [points[1][1], points[2][1]], 'b')

# plot points
for point in points:
    ax.plot(point[0], point[1], 'o')

ax.set_aspect("equal")

plt.show()

这将会给出:

enter image description here

如何在不使用Matplotlib的PathPatch对象的情况下完成此操作,您可以像this answer中所示计算Bezier点,我将在下面使用相同方法进行操作(请注意,为了避免使用Scipy的comb函数,我已经从here使用了comb函数):

import numpy as np
from math import factorial
from matplotlib import pyplot as plt

def comb(n, k):
    """
    N choose k
    """
    return factorial(n) / factorial(k) / factorial(n - k)


def bernstein_poly(i, n, t):
    """
     The Bernstein polynomial of n, i as a function of t
    """

    return comb(n, i) * ( t**(n-i) ) * (1 - t)**i


def bezier_curve(points, n=1000):
    """
       Given a set of control points, return the
       bezier curve defined by the control points.

       points should be a list of lists, or list of tuples
       such as [ [1,1], 
                 [2,3], 
                 [4,5], ..[Xn, Yn] ]
        n is the number of points at which to return the curve, defaults to 1000

        See http://processingjs.nihongoresources.com/bezierinfo/
    """

    nPoints = len(points)
    xPoints = np.array([p[0] for p in points])
    yPoints = np.array([p[1] for p in points])

    t = np.linspace(0.0, 1.0, n)

    polynomial_array = np.array(
        [bernstein_poly(i, nPoints-1, t) for i in range(0, nPoints)]
    )

    xvals = np.dot(xPoints, polynomial_array)
    yvals = np.dot(yPoints, polynomial_array)

    return xvals, yvals


# set control points (as in the first example)
points = [(3, 6.146), (4, 8), (6, 8.25)]

# get the Bezier curve points at 100 points
xvals, yvals = bezier_curve(points, n=100)

# make the plot
fig, ax = plt.subplots()

# lines between control points
ax.plot([points[0][0], points[1][0]], [points[0][1], points[1][1]], 'b')
ax.plot([points[1][0], points[2][0]], [points[1][1], points[2][1]], 'b')

# plot control points
for point in points:
    ax.plot(point[0], point[1], 'o')

# plot the Bezier curve
ax.plot(xvals, yvals, "k--")

ax.set_aspect("equal")

fig.show()

这将得到:

enter image description here


嗨,马特,非常感谢您的回复。虽然我正在使用它来展示我的项目,但我实际上用Matplotlib不是为了倾斜一个点。也许您知道用Python或Numpy获取这些点的方法吗? - Dr. Pontchartrain
1
我已更新答案,包括如何在不使用Matplotlib的情况下获取Bezier曲线点。这基本上是基于此答案https://dev59.com/E2cs5IYBdhLWcg3wtmID#12644499。 - Matt Pitkin
Matt,非常感谢。这个非常有效。 - Dr. Pontchartrain

1

0
def line_intersection(line1, line2):
    xdiff = (line1[0][0] - line1[1][0], line2[0][0] - line2[1][0])
    ydiff = (line1[0][1] - line1[1][1], line2[0][1] - line2[1][1])

    def det(a, b):
        return a[0] * b[1] - a[1] * b[0]

    div = det(xdiff, ydiff)
    if div == 0:
       raise Exception('lines do not intersect')

    d = (det(*line1), det(*line2))
    x = det(d, xdiff) / div
    y = det(d, ydiff) / div
    return x, y
    
line_segment1 = [[1,1],[4,8]]
line_segment2 = [[4,8],[8,8]]
line = line_segment1 + line_segment2
plot_line(line,'k-')
radius = 3  #the required radius
# angle
angle = calculate_angle(4, 8, 1, 1, 8, 8)  #red point,purple point,green point
print(angle)

#the distance between point1 and radius from point1
dist=radius/np.tan(angle/2)

l1_x1 = line_segment1[0][0]
l1_y1 = line_segment1[0][1]
l1_x2 = line_segment1[1][0]
l1_y2 = line_segment1[1][1]
new_point1 = travel(dist, l1_x2, l1_y2, l1_x1, l1_y1)

输入图片描述


请明确代码的功能以及它如何以及为什么回答了这个问题。请访问如何撰写一个好的答案?页面获取更多详细信息。 - undefined

网页内容由stack overflow 提供, 点击上面的
可以查看英文原文,
原文链接